Join Our Telegram channel to stay up to date on breaking news coverage
Bitcoin Cash price was turning down mid-week as crypto prices flashed red across the board. BCH was trading at $141, down 6% on the day and its trading volume was at $343 million after dropping 125 in the past 24 hours. With a live market cap of $2.732 billion, this peer-to-peer electronic payment coin was positioned at #28 on the CoinMarketCap ranking.
Other top-cap cryptos were also recording losses with Bitcoin losing 3.5% in the last 24 hours to trade just below $24,000. The second largest crypto by market capitalization Ethereum has lost 3.85% of its value to trade at $1,00 while Binance’s BNB was down 2.87% to $306. Polygon (MATIC) was the largest loser among the top 10 cryptocurrencies, down 8.5% to $1.31.
Accordingly, the global crypto market capitalization was down 3.65% to $1.09 trillion. The total crypto market volume over the last 24 hours is $69.15 billion, which makes an 11.69% increase.
Despite this market-wide downturn, investor sentiment remained bullish. Data from Alternative showed that the Crypto Fear & Greed index was still in the “Greed” zone, suggesting that traders were buying more with the hope that the prices will continue to rise to increase their returns.
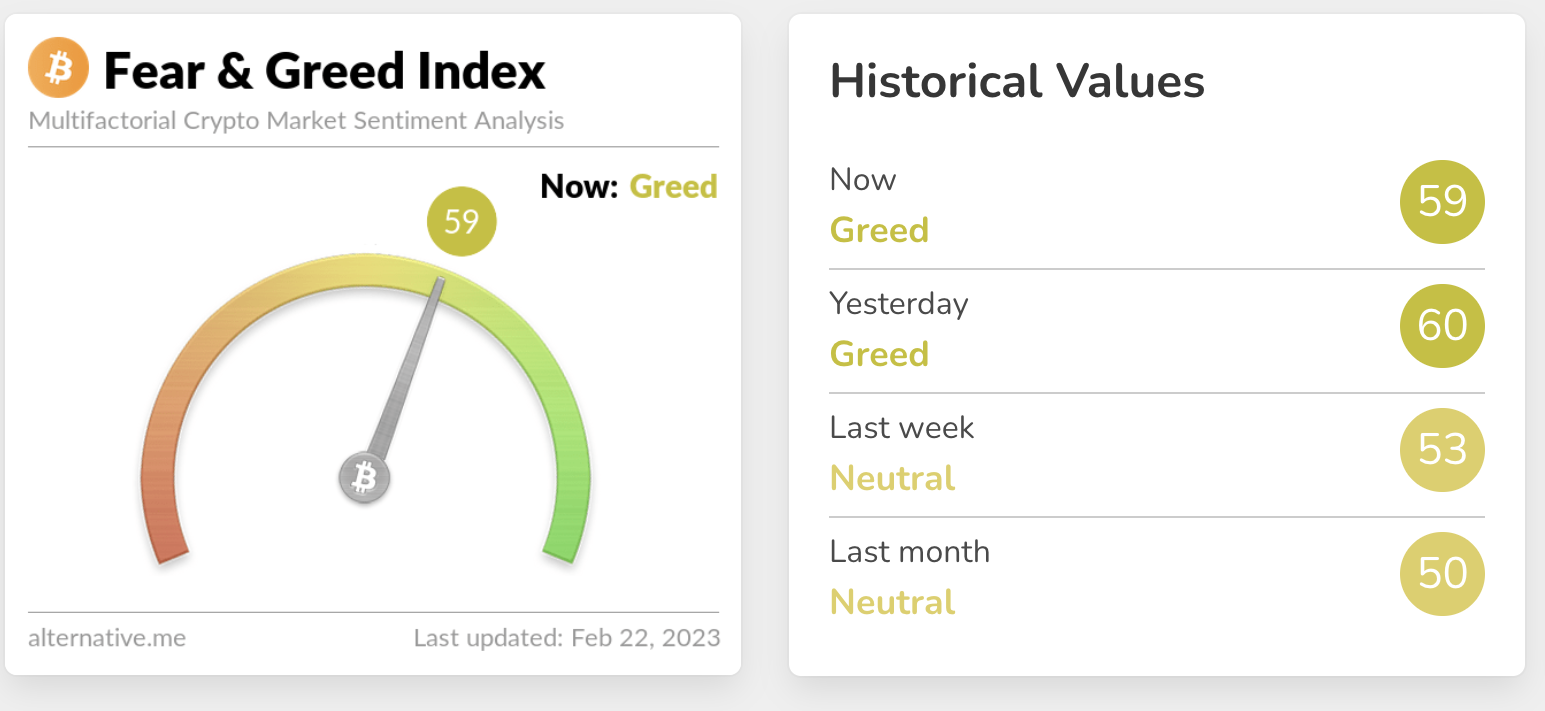
The same could be said for Bitcoin Cash as on-chain metrics and technical indicators showed that the BCH price was still bullish.
Bitcoin Cash Price Sits On Strong Support At $140
BCH price action between February 2 and 20 painted a V-shaped recovery pattern on the daily chart (see below). On Monday, Bitcoin Cash escaped from this highly bullish technical setup before turning down on Wednesday to trade below the neckline of the chart pattern at $143.57.
As such, a daily candlestick close above $143 would confirm a bullish breakout with the first barrier being found at the $150 psychological level. Additional roadblocks would emerge from the $154 local high and the $160 supply level before reaching the $164 range high. Such a move would represent a 16.32% uptick from the current price.
BCH/USD Daily Chart
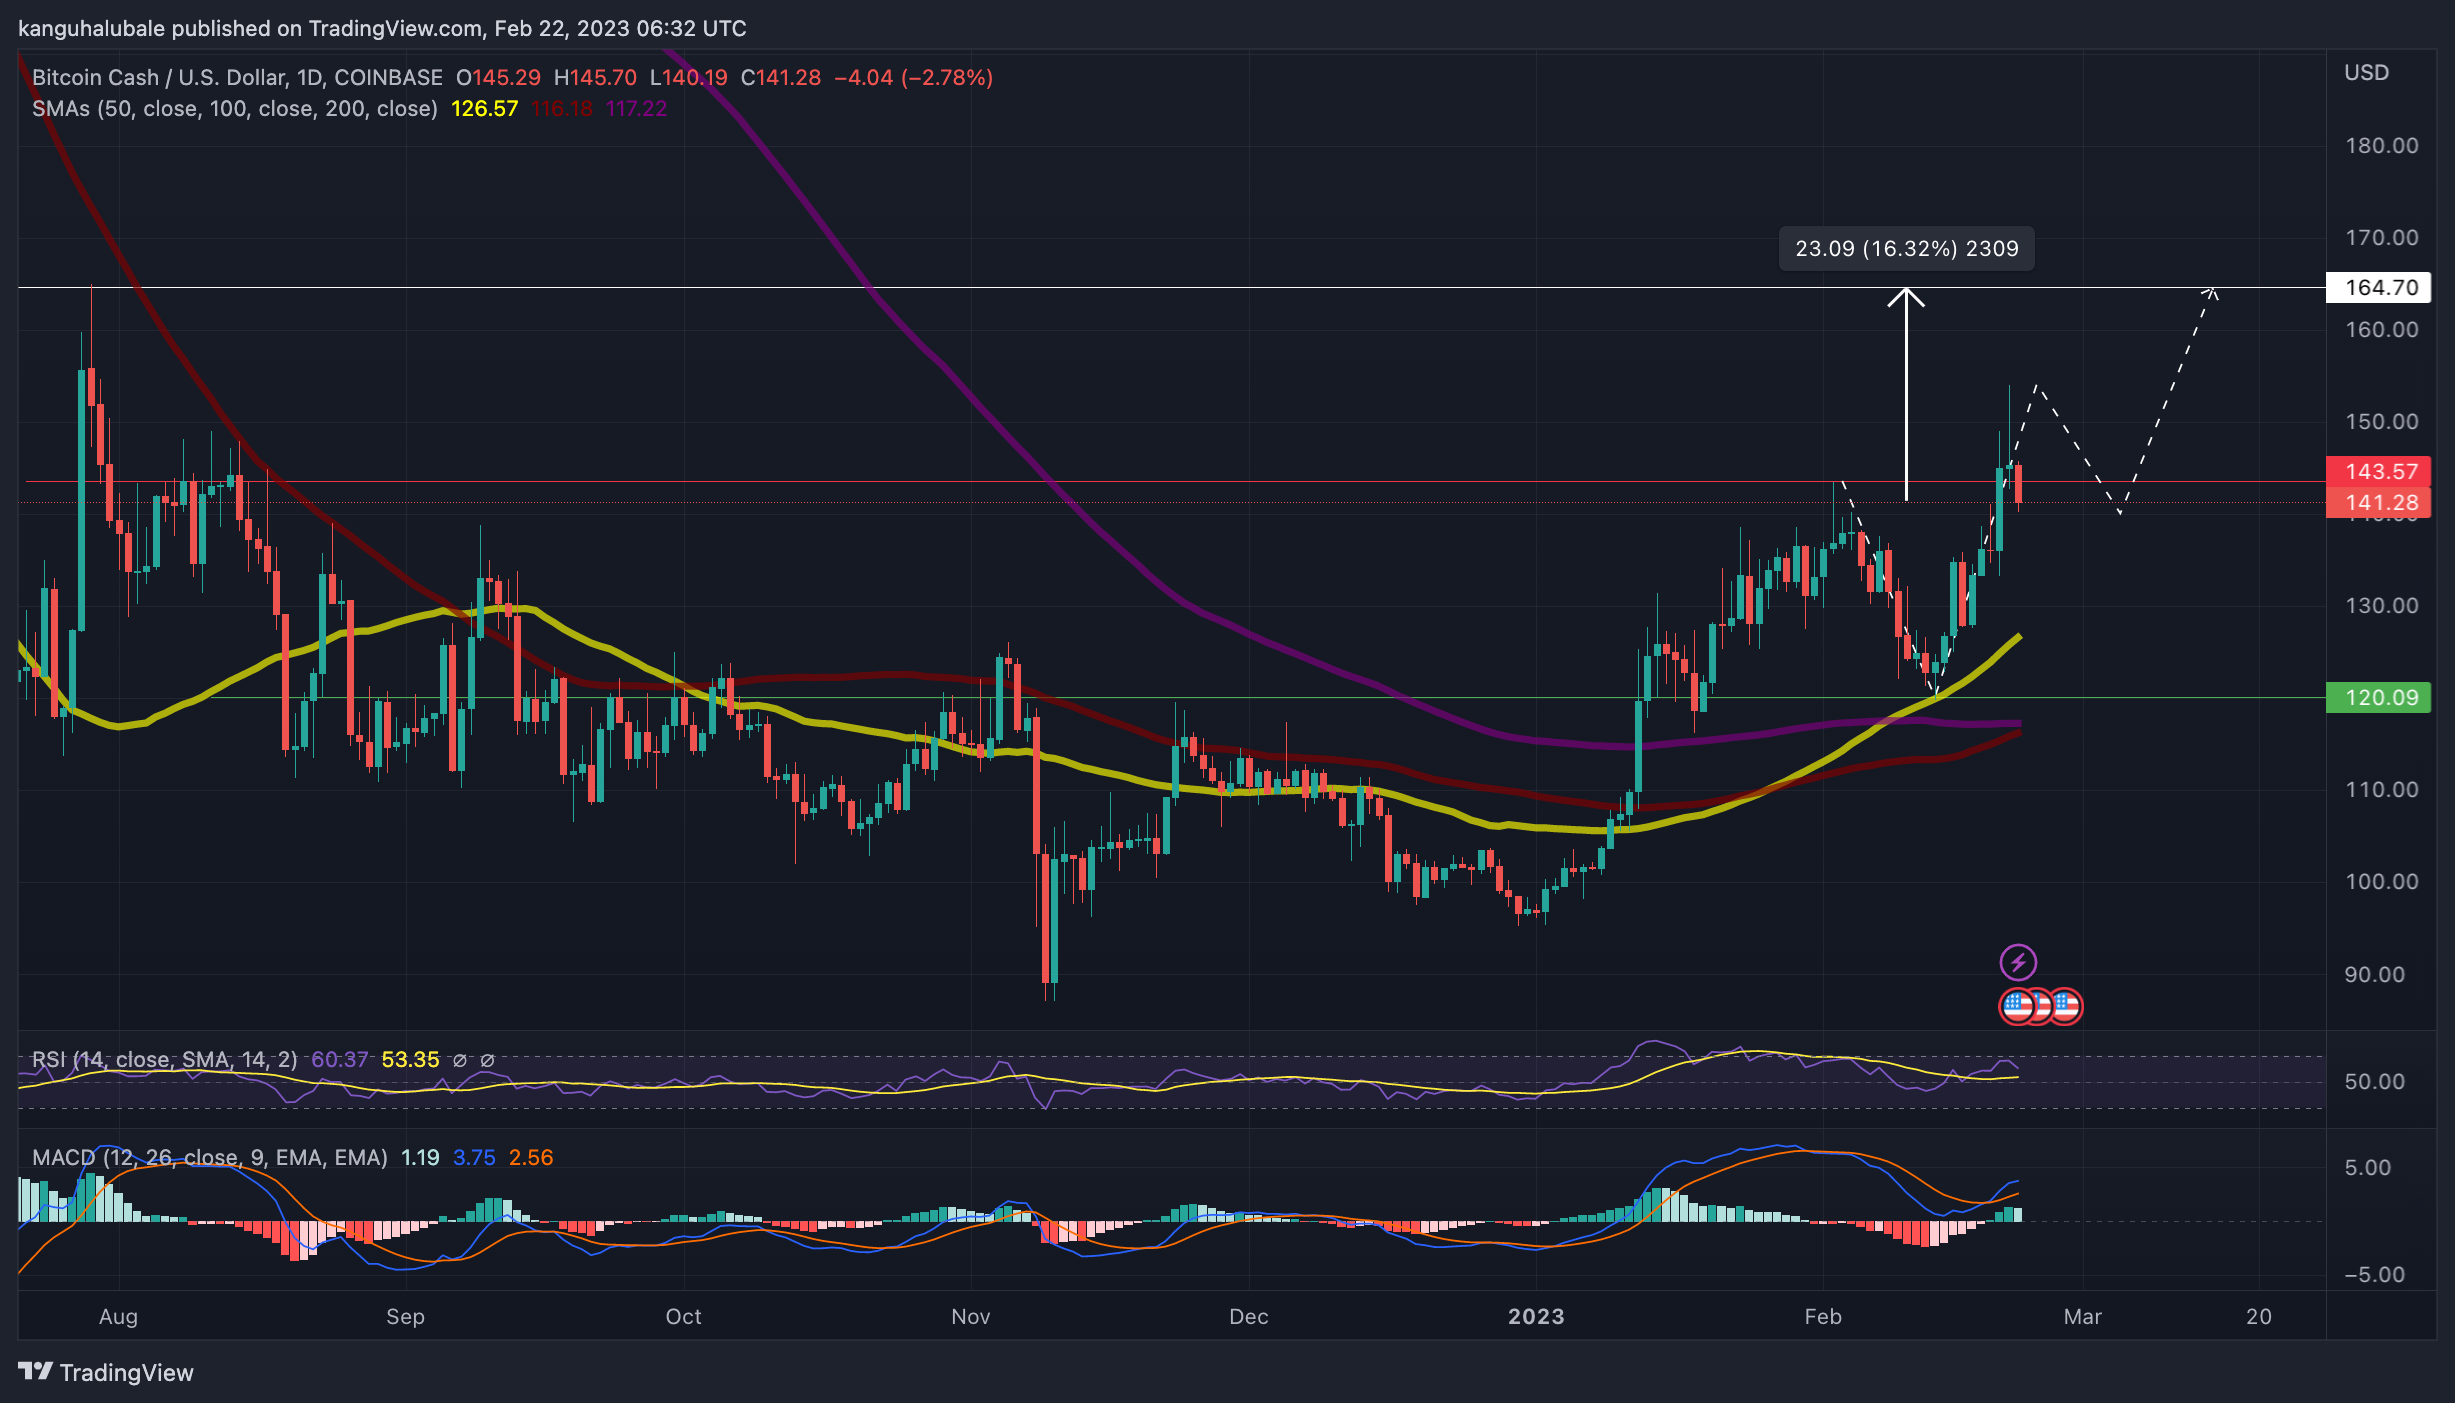
Apart from the bullish V-shaped recovery technical formation, the MACD and the moving averages (MAs) were facing upwards. Note that the February 8 “golden cross” from the MAs and the buy signal sent by the MACD on Sunday were still in play, suggesting that the market conditions favored the upside.
In addition, the Relative Strength Index (RSI) was positioned in the positive region above the midline. The price strength at 60 suggested that there were more buyers than sellers in the market.
Moreover, Bitcoin Cash enjoyed strong support on the downside. These were areas defined by the immediate support at $140, the $130 psychological level, and the 50-day Simple Moving Average (SMA) at $126. Additional lines of defense are lying at the $120 support wall and the $17 demand level, embraced by both the 100-day and 200-day SMAs.
BCH’s robust support is further validated by on-chain metrics from IntoTheBlock’s In/Out of the Money Around Price (IOMAP) model. According to the IOMAP chart below, Bitcoin Cash has relatively strong support on the downside compared to the resistance it faces on its path upwards. The immediate support at $140 is stronger than the immediate resistance at $145 because it is around where 18.56 trillion BCH were previously bought by 163,840 addresses.
Bitcoin Cash IOMAP Chart
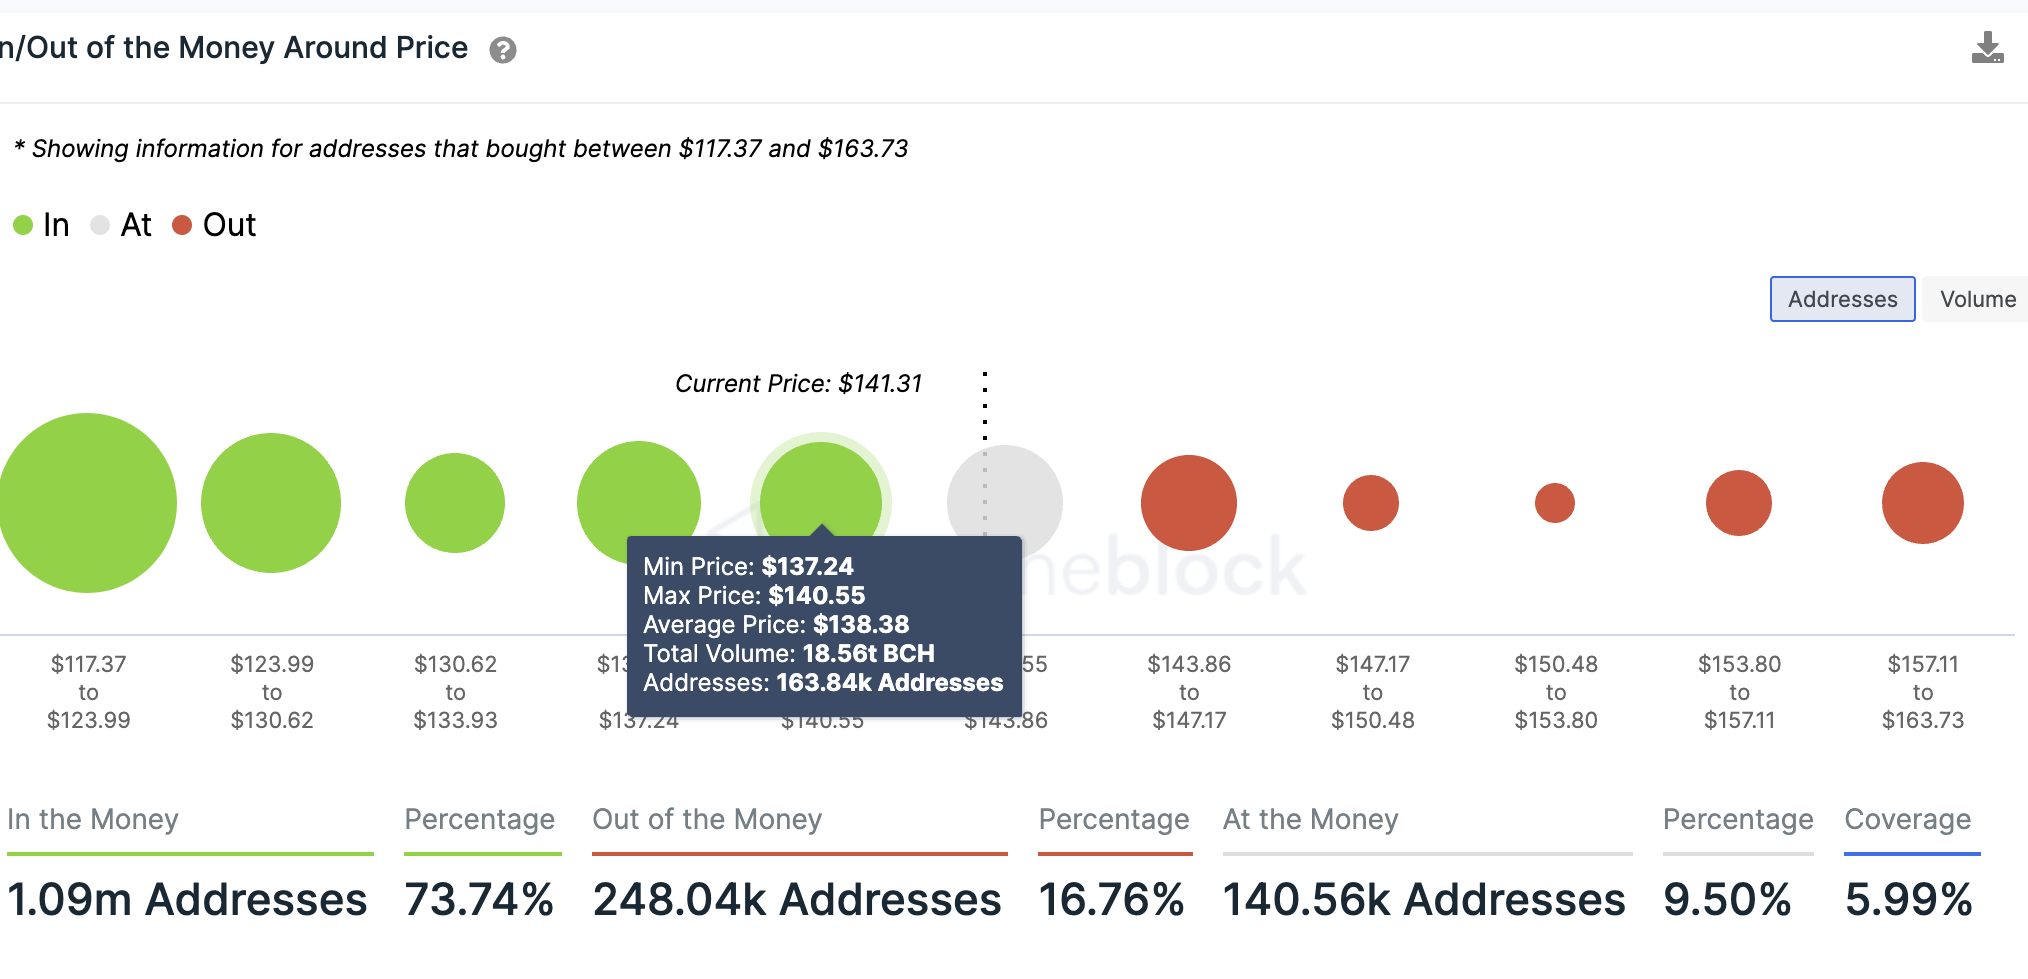
As such, the path with the least resistance for the Bitcoin Cash price is northward. Given this analysis, it is safe to say that BCH may potentially move toward $165 in the near term.
On the downside, the RSI was facing down, away from the overbought region. This indicated the inability of the buyers to sustain the higher levels as sellers booked profits.
Increasing selling pressure from the current price could, therefore, see BCH drop below $140 to seek solace from the $130 support floor. Traders could expect Bitcoin Cash to spend a few days around this region before making another attempt at recovery.
Read More:
- Arbitrum Scammed Out Of $2 Million
- Trust Wallet Token Price Prediction – TWT Up 0.2% As Sell Signals Get Louder
- How to Buy Cryptocurrencies
Best Wallet - Diversify Your Crypto Portfolio
- Easy to Use, Feature-Driven Crypto Wallet
- Get Early Access to Upcoming Token ICOs
- Multi-Chain, Multi-Wallet, Non-Custodial
- Now On App Store, Google Play
- Stake To Earn Native Token $BEST
- 250,000+ Monthly Active Users
Join Our Telegram channel to stay up to date on breaking news coverage
