
Join Our Telegram channel to stay up to date on breaking news coverage
The Bitcoin price prediction is currently consolidating and seems to be preparing for the next move above the resistance level of $26,000.
Bitcoin Prediction Statistics Data:
- Bitcoin price now – $24,571
- Bitcoin market cap – $472.3 billion
- Bitcoin circulating supply – 19.2 million
- Bitcoin total supply – 19.2 million
- Bitcoin Coinmarketcap ranking – #1
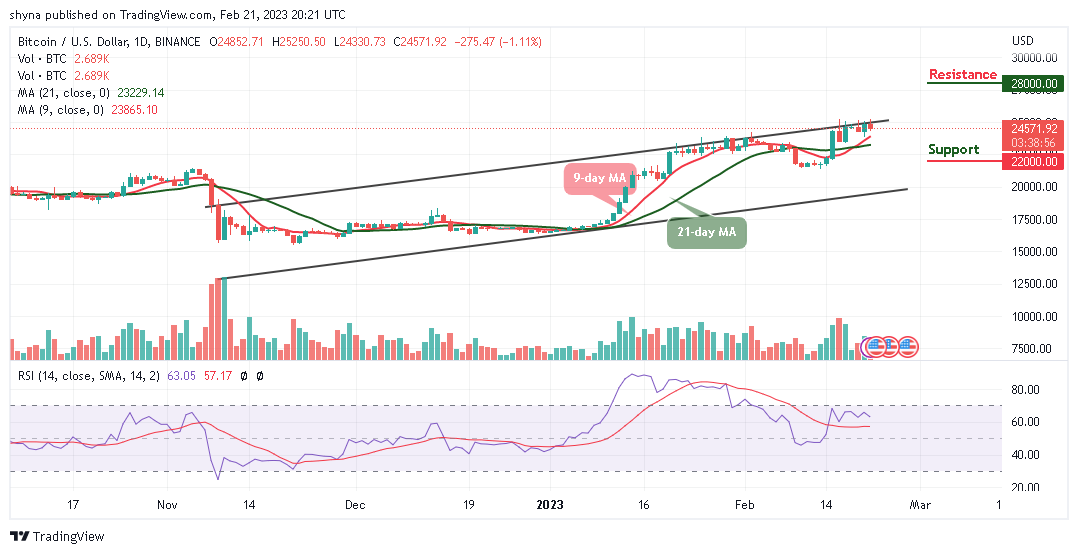
BTC/USD Long-term Trend: Ranging (Daily Chart)
Key levels:
Resistance Levels: $28,000, $29,000, $30,000
Support Levels: $22,000, $21,000, $20,000
BTC/USD is yet to stay above the resistance level of $25,000 with the current consolidation pattern once again as it fails to close above the upper boundary of the channel. The Bitcoin (BTC) begins the day off by trending higher toward the north only to roll over and fall lower to trade back inside the channel. Similarly, the first level of support could be located at around $24,000. Beneath this, supports lie at $22,000, $21,000, and $20,000.
Bitcoin Price Prediction: Bitcoin (BTC) May Break to the Upside
The Bitcoin price is consolidating below the 9-day and 21-day moving averages; however, this is looking less and less likely with each failed breakout attempt as the technical indicator Relative Strength Index (14) remains above the 60-level. On the next positive move, BTC is likely to break above the channel. Although the candle is still yet to close and it does look that the bulls may end up closing above this barrier as the potential resistance levels could be found at $28,000, $29,000, and $30,000.
BTC/USD Medium-term Trend: Ranging (4H Chart)
Looking at the 4-hour chart, BTC/USD may need to recover above $25,000 and move towards the upper boundary of the channel to mitigate the short-term bearish pressure in other to hit the nearest resistance level of $26,000. However, this psychological barrier may be closely followed by the resistance level of $26,500 and above.
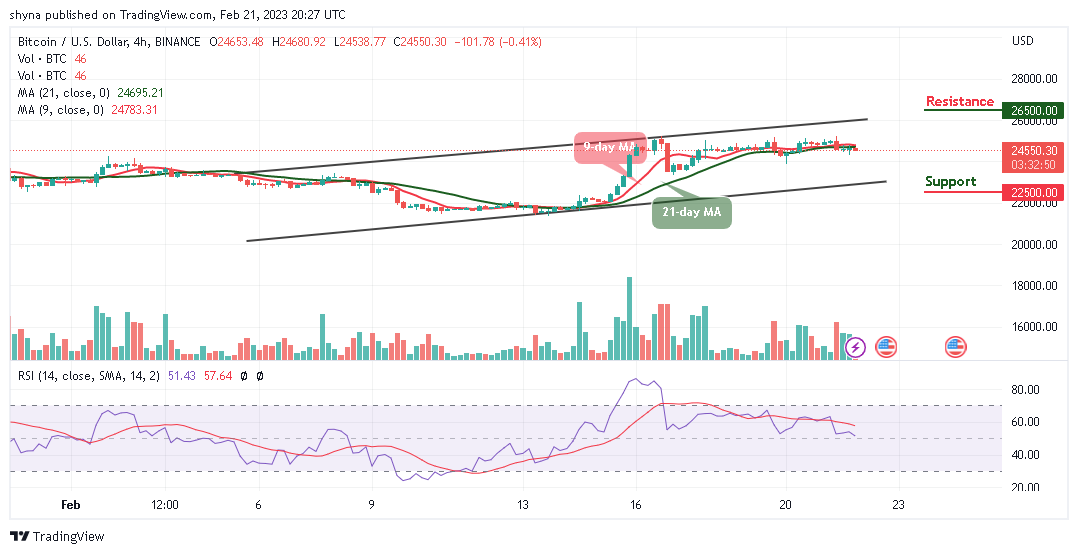
On the contrary, the nearest support may come at $24,000, and a sustainable bearish movement can increase the downside pressure and bring the price toward the support level of $22,500 and $below. Considering that the technical indicator Relative Strength Index (14) is seen moving above the 50-level, traders might expect the king coin to face the upside.
Bitcoin Alternatives
The Bitcoin price is getting ready for another spike to the upside but if the market capitalization of BTC drops considerably, the selling strength could build up in the market, and Bitcoin (BTC) could face the downside. Meanwhile, Fight Out’s crypto presale has recently commenced and the project has been witnessing impressive traction from users and the investor community. As a result of this, close to $5 million has now been raised with the price of FGHT tokens increasing tremendously.
Join Our Telegram channel to stay up to date on breaking news coverage