Join Our Telegram channel to stay up to date on breaking news coverage
BCH Price Prediction – November 9
The BCH bulls are showing commitment as the market approaches the $282 resistance on a retracement move.
BCH/USD Market
Key Levels:
Resistance levels: $318, $328, $338
Support levels: $250, $240, $230
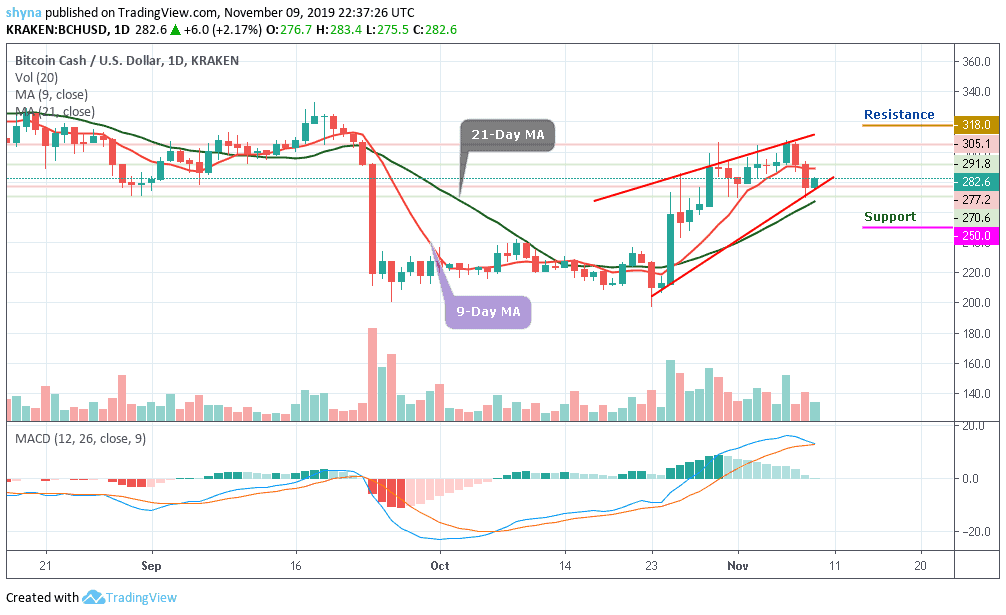
When we look at the two straight days of massive declines, BCH/USD is seen on a steady recovery mode so far today, as the weekend love for the cryptocurrencies seems to have returned. The coin bounced-off eleven-day trough of $270.6 reached in Friday’s trading and now trades around $282 level, gaining 2.17% within 24 hours.
Meanwhile, several supports have been useful, including the upward trend line and the 21-day moving average at $265. Despite all these, the price action during the trading hours has been relatively bullish following the ascending channel formation. The Moving Average Convergence and Divergence (MACD) signal a bullish crossover to show that the buyers are still in control of the market.
In addition, BCH/USD seems to pick up its pace and has risen above $294 today before dropping but the coin is still moving above the 9-day and 21-day MA. More so, by observing the movement of the coin, the Bitcoin Cash has been showing an uneven movement with several rises and falls. The traders will discover that the coin has not been able to maintain a consistent bullish run. It is likely the market may start showing some signs of a downward movement slowly from the latter part of the day.
When compared with Bitcoin, the coin is still maintaining an upward movement against Bitcoin at the moment but as it appeared, though trading above the 9-day and 21-day moving averages, the daily chart reveals that there’s a low amount of buying pressure in the market. Bitcoin Cash is waiting for the technical indicator to decide which trend the market will follow as the stochastic RSI moves in sideways.
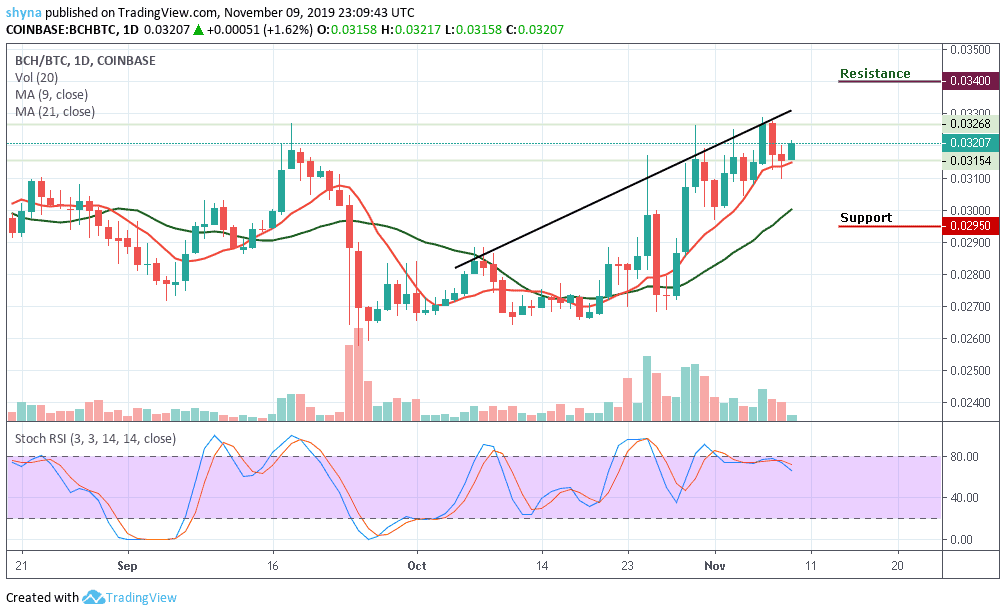
Nevertheless, the bulls are waiting for a break above the 0.326 BTC to touch the nearest resistance level of 0.033 BTC. Similarly, if the bulls fail to push the market upward; it could easily fall to 0.0310 BTC support and the resistance to watch are 0.034 BTC and above. More so, while trading at 0.0310 BTC support, a bearish continuation may touch the 0.0295 BTC and below.
Please note: Insidebitcoins.com is not a financial advisor. Do your research before investing your funds in any financial asset or presented product or event. We are not responsible for your investing results.
Join Our Telegram channel to stay up to date on breaking news coverage