Join Our Telegram channel to stay up to date on breaking news coverage
BCH Price Analysis – August 15
Bitcoin Cash’s sudden dip below $330 concerns traders, BCH may reclaim $320 by the end of the day.
BCH/USD Market
Key Levels:
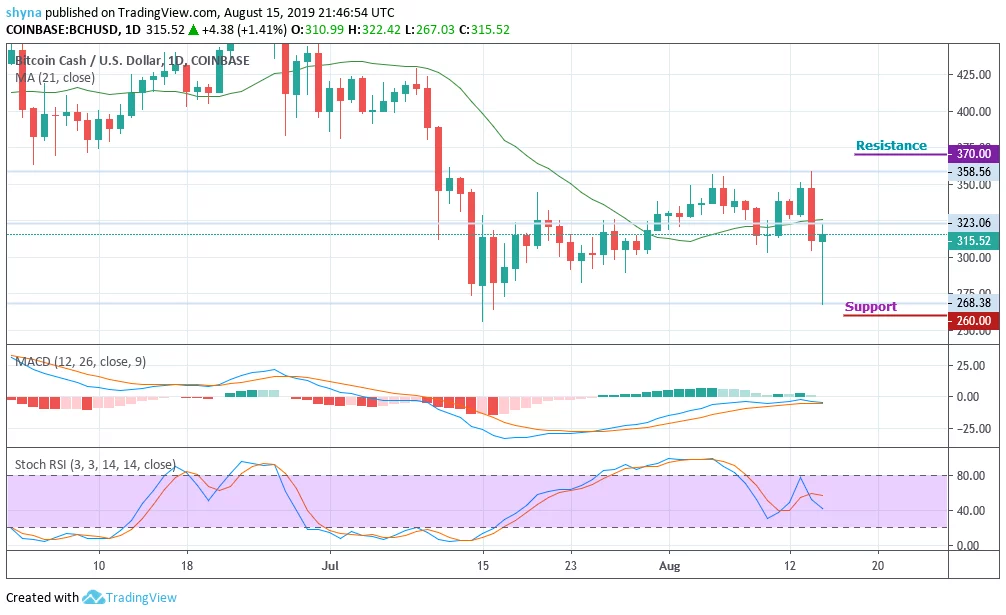
Resistance levels: $370, $380, $390
Support levels: $260, $250, $240
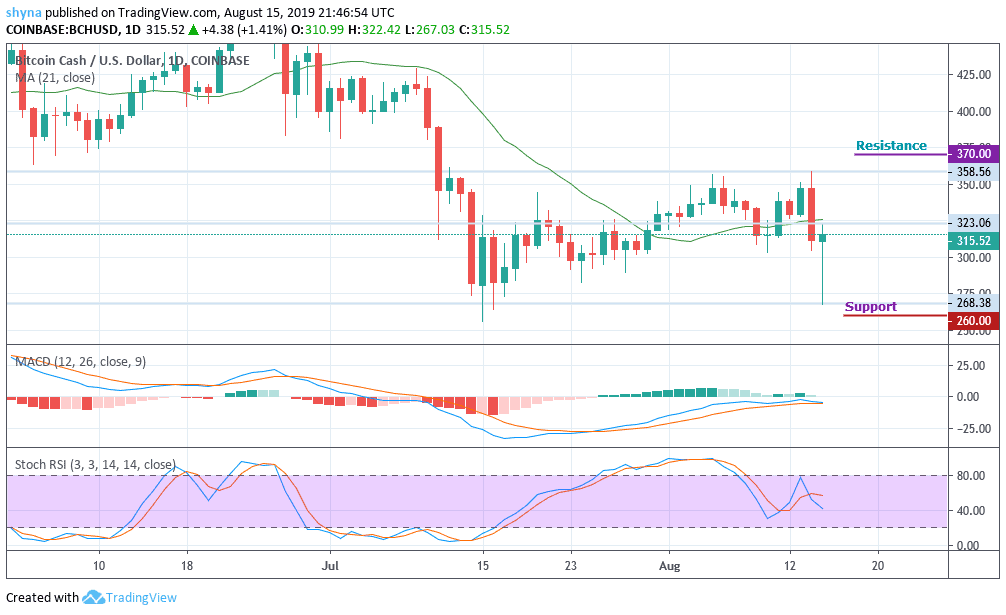
Over the past 7 days, the highest recorded Bitcoin Cash (BCH) value was approximately $358 and it dropped almost suddenly in less than a day to go below the $320 mark. The market broke down today, reaching its lowest daily level at $268. The current performance of the coin in the market is below the normal expectations of traders and the coin could soon recover from these downtrends.
Bitcoin Cash breaks back above $300 following yesterday’s crypto sell-off. The MACD and Stochastic indicators are also both in the bullish territory as the price makes the quick push to reach $323. The MACD histogram has made another push higher to peak as the moving averages diverge.
However, if the market drives below the $300 support, BCH price could slump to $260, $250 and $240, bringing the price to a new low. Meanwhile, a strong buying pressure may take the price to $350 resistance. While trading at $350, a bullish continuation is likely to touch the $370, $380 and $370 resistance levels.
BCH/BTC Market
A few days ago, the Bitcoin Cash has been an attempt to rise against Bitcoin but as it appeared, there’s a low amount of buying pressure in the market which is why the price started dropping again since yesterday. BCH price broke the ascending channel to touch the nearest support level of 0.028 BTC.
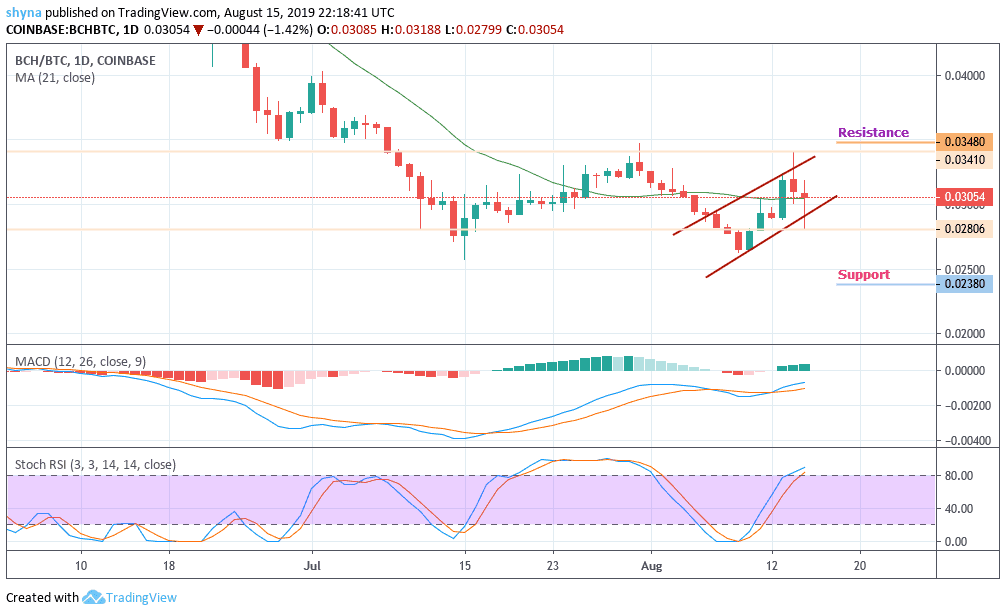
Moreover, if the bulls fail to stop the selling pressure; the resistance in this range is at 0.037BTC and support is at 0.023BTC. While trading at 0.030 BTC, a bearish continuation may touch the 0.024 BTC and 0.022 BTC supports. Furthermore, a breach could slump the market to 0.018 BTC support, creating a new low below the rising channel. The MACD and Stochastic indicators are both in bullish territory, which indicates more bullish signals.
Please note: insidebitcoins.com is not a financial advisor. Do your research before investing your funds in any financial asset or presented product or event. We are not responsible for your investing results.
Join Our Telegram channel to stay up to date on breaking news coverage