Join Our Telegram channel to stay up to date on breaking news coverage
BCH Price Analysis – January 14
By comparing the price of BCH coin when it reached an all-time high, which was $388 on May 11, 2019, the current price may definitely give us a downward trend in the nearest term.
BCH/USD Market
Key Levels:
Resistance levels: $375, $380, $385
Support levels: $240, $235, $230
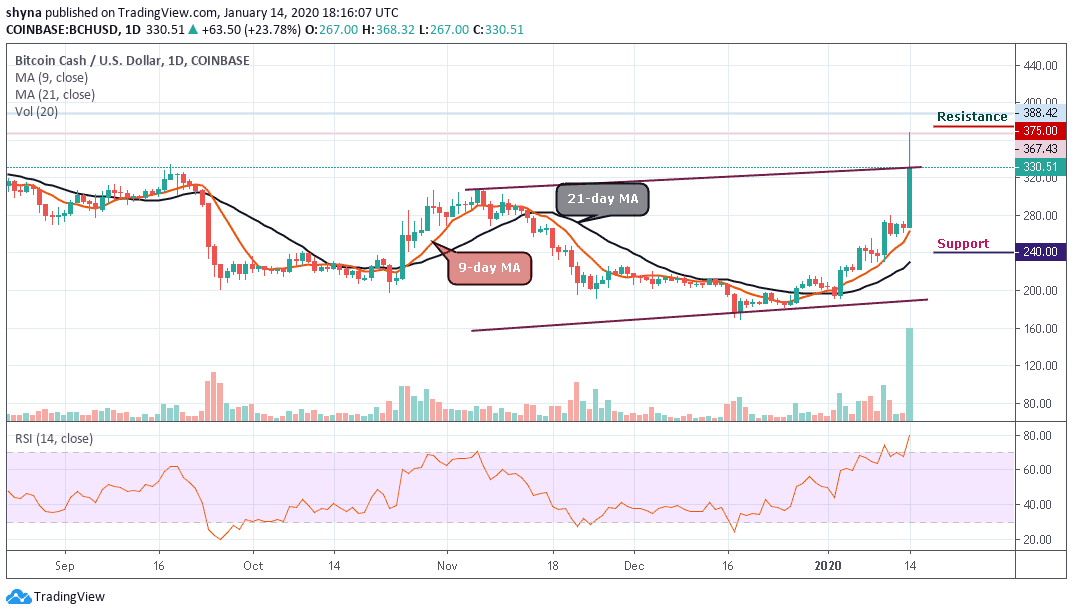
Today, the cryptocurrency market is painted green everywhere after a return of the bulls to avenge the blows they endured all weekend and yesterday too. BCH/USD has not been left behind, besides the crypto asset is trading 23.78% higher towards the end of the Asian session. The price is brushing shoulder with the resistance at $330 (levels that have not been achieved since November 2019).
However, the daily chart clearly shows the bulls fully in control. They are supported by the upward moving RSI (14) indicator. If the indicator remains within the overbought zone, BCH/USD could easily take the action closer to $350. While trading at $350, a bullish continuation is likely to touch the $375, $380 and $385 resistance levels.
Looking at the support, $260 still stands as an incredible zone with high congestion of the buyers. The 9-day moving average currently at $250 will cushion the drop, in addition to the 21-day moving average support at $240. If push comes to shove and declines proceed further, $235 and $230 support levels will come in handy.
BCH/BTC Market
Against BTC, the market bounces back today as the market price moves well above the 9-day and 21-day moving averages. A few days ago, BCH couldn’t break above the 3400 SAT but as the market open today, the coin has now signaled a bullish ally and it eventually broke up the channel, which raised the price from 3295 SAT to 3724 SAT.
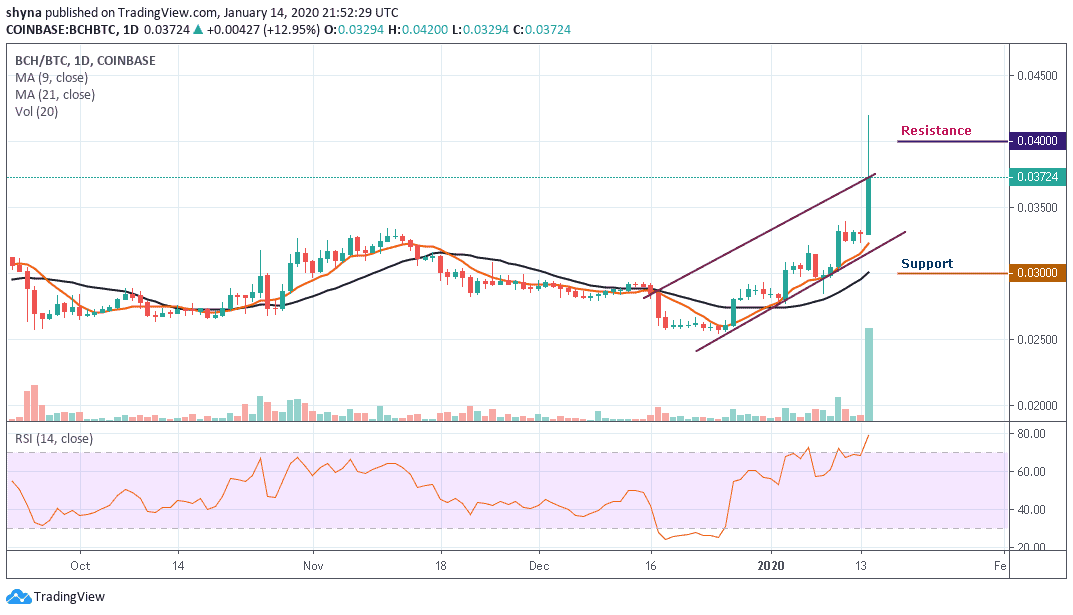
If the pressure rises, Bitcoin cash may likely meet resistance at 4000 SAT and 4200 SAT as the RSI (14) rising up too. Meanwhile, from the market structure, we can say the bulls have regained control of the market. But as it stands now, Bitcoin Cash is likely to retrace to the break level around 3500 SAT. Should Bitcoin Cash drops below this level, the price may find support at 3000 SAT and 2800 SAT levels.
Please note: Insidebitcoins.com is not a financial advisor. Do your research before investing your funds in any financial asset or presented product or event. We are not responsible for your investing results.
Join Our Telegram channel to stay up to date on breaking news coverage