Join Our Telegram channel to stay up to date on breaking news coverage
Key Points Bitcoin cash price declined sharply and moved below the $1,000 support against the US Dollar. Yesterday’s highlighted major bearish trend line with current resistance at $1,080 is intact on the hourly chart of the BCH/USD pair (data feed from Kraken). The pair is currently correcting higher towards the $1,050 and $1,080 resistance levels in the near term.
Bitcoin cash price failed to recover and declined below $1,000 against the US Dollar. BCH/USD may correct higher, but upsides are likely to be limited.
Bitcoin Cash Price Decline
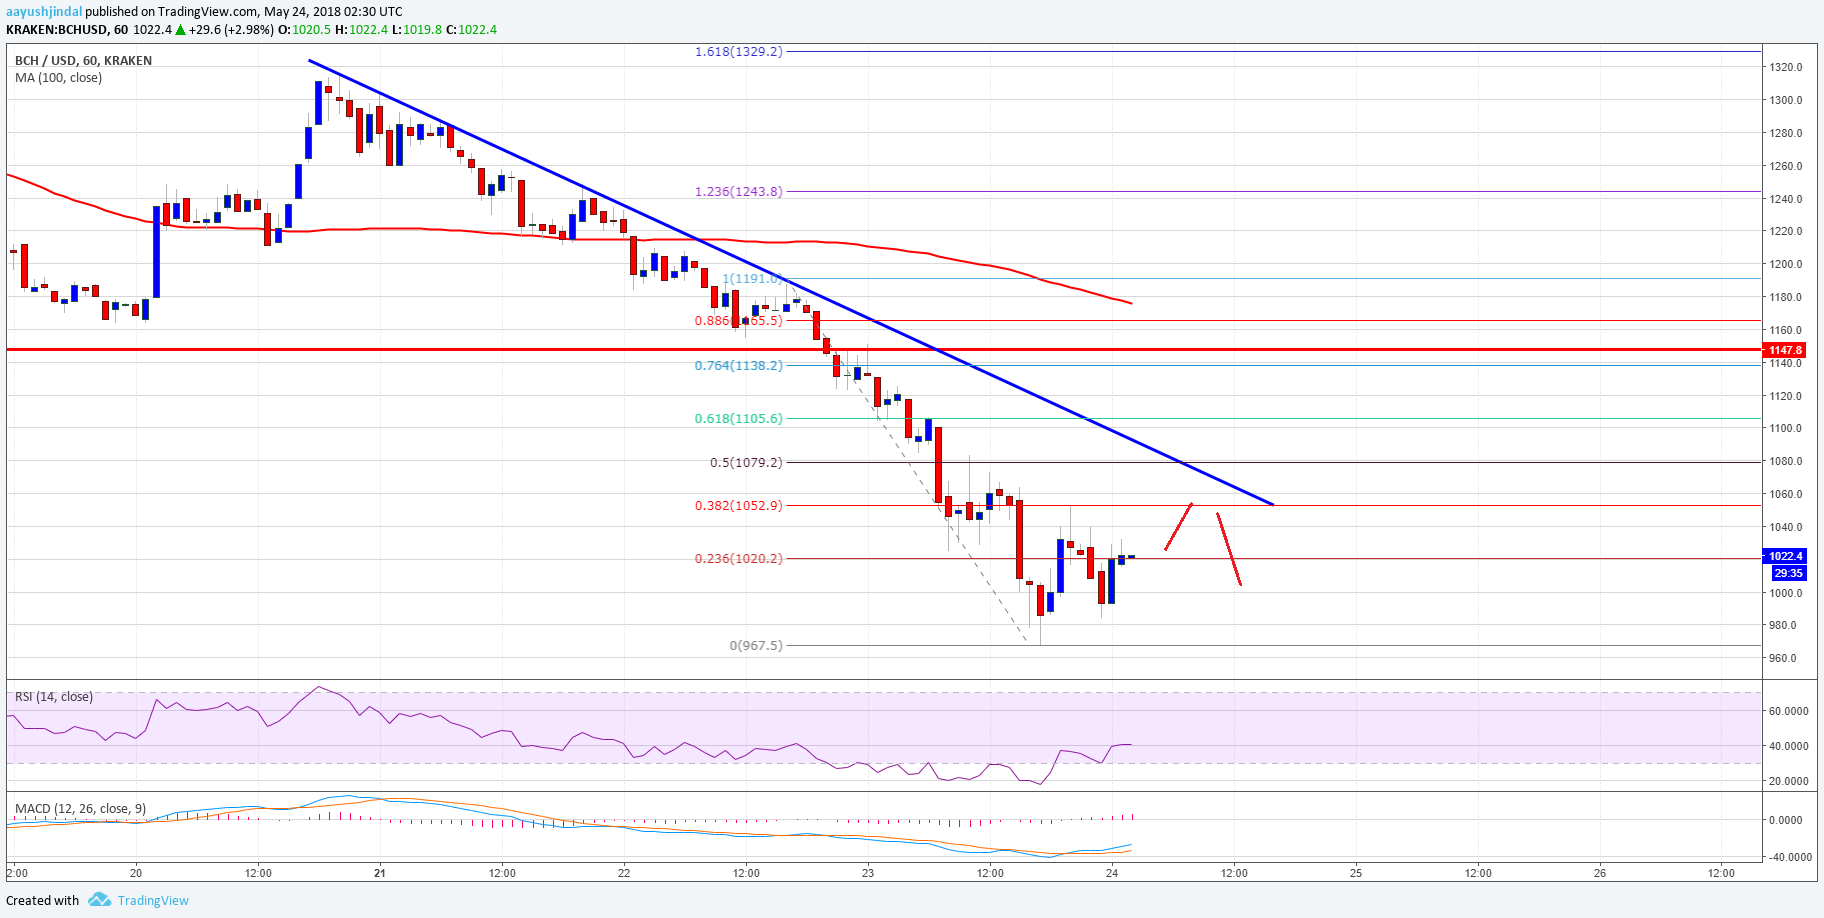
There was a sharp increase in selling pressure from $1,150 in bitcoin cash price against the US Dollar. The price declined sharply and broke many supports such as $1,100 and $1,050. The decline was such that sellers succeeded in pushing the price below the $1,000 handle. BCH is now trading well below the $1,100 pivot level and the 100 hourly simple moving average.
It traded as low as $967.5 recently before buyers appeared. At the moment, the price is consolidating losses with a correction angle towards $1,100. An initial resistance is near the 38.2% Fib retracement level of the last decline from the $1,191 high to $967 low. More importantly, yesterday’s highlighted major bearish trend line with current resistance at $1,080 is intact on the hourly chart of the BCH/USD pair. The same trend line resistance is close to the 50% Fib retracement level of the last decline from the $1,191 high to $967 low. Therefore, if the price corrects higher, it could face sellers near the $1,050 and $1,080 levels.
Looking at the chart, the price is in a bearish trend with a decent support near $960-80. A break below the mentioned $960 support may open the doors for a push towards the $900 level.
Looking at the technical indicators:
Hourly MACD – The MACD for BCH/USD is slowly recovering in the bullish zone.
Hourly RSI (Relative Strength Index) – The RSI for BCH/USD is moving higher and is currently 40.
Major Support Level – $980
Major Resistance Level – $1,080
The post Bitcoin Cash Price Analysis: BCH/USD Jaw Dropped Below $1,000 appeared first on NewsBTC.
Join Our Telegram channel to stay up to date on breaking news coverage