
Join Our Telegram channel to stay up to date on breaking news coverage
Bitcoin Cash (BCH) Price Prediction – November 24, 2020
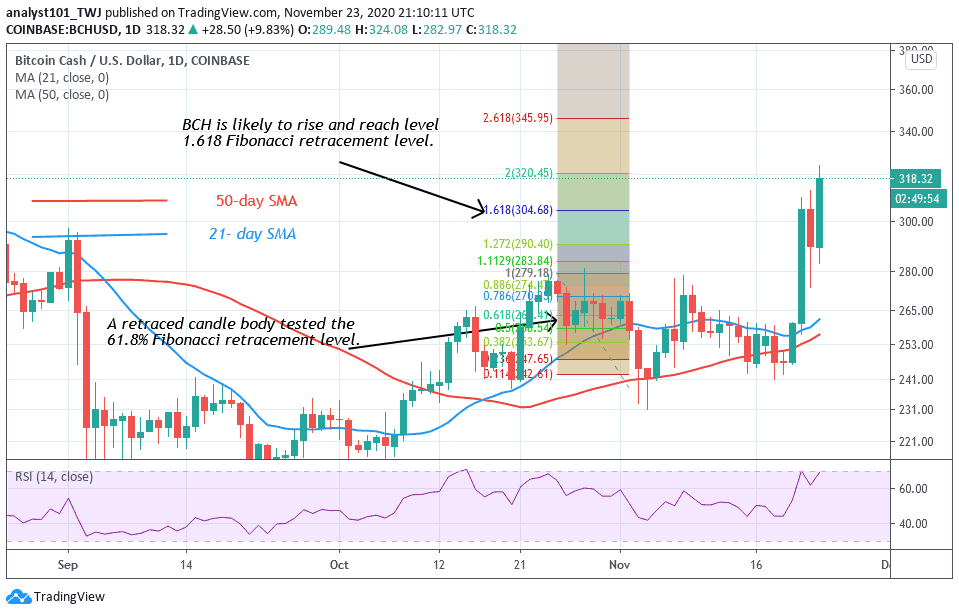
Bitcoin Cash rebounded as price breaks the $280 overhead resistance. The coin is trading now in the bullish trend zone. The upside momentum has continued as price breaks above $320. BCH/USD is likely to rally above $340 if the current momentum is sustained. In the BCH/BTC, the crypto is recovering from the downtrend after a rebound.
Key Levels:
Resistance Levels: $280, $320, $340
Support Levels: $200, $160, $120
Bitcoin Cash is out of a downward correction after the recent rebound. The bulls broke the $280 overhead resistance on November 23. The overhead resistance has been the major impediment to BCH’s upward move. The crypto has gained price acceleration as the price broke the $320. On the upside, if buyers push BCH above $320, the coin will rally above $340. Also, the coin will be out of the bear market. The crypto will continue the sideways move below the recent high if buyers fail to break the resistance at $320. In the meantime, buyers have continued to push the coin on the upside. Today, BCH is trading at $330 at the time of writing.
Bitcoin Cash Indicator Analysis
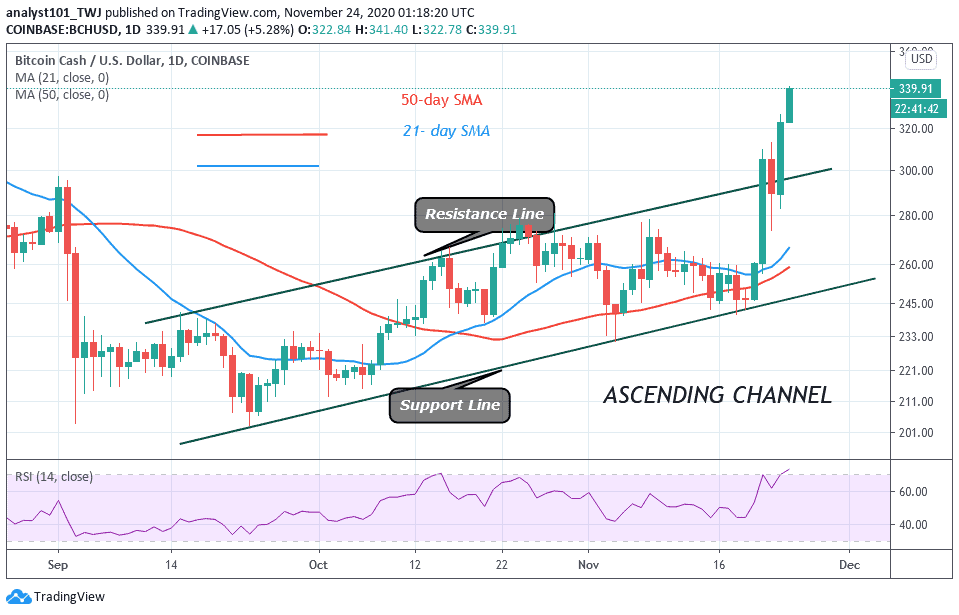
The resistance line of the ascending channel has been broken in the recent price surge. When the price breaks and closes above the resistance line, it indicates that there is a change in trend. The coin is at level 71 of the Relative Strength index period 14. It indicates the coin is in the overbought region of the market.

In the BCH/BTC chart, the market has reached bearish exhaustion as the crypto rebounded at the bottom of the chart. On November 5 downtrend; the retraced candle body tested the 78.6 % Fibonacci retracement level. It indicates that the coin will fall and reverse at level 1.272 Fibonacci extensions or the low of Ƀ0.013616 low. The Fibonacci tool analysis indicated that BCH/BTC will reverse at level 1.272 but the reversal will not be immediate.
Join Our Telegram channel to stay up to date on breaking news coverage