Join Our Telegram channel to stay up to date on breaking news coverage
Bitcoin (BTC) Price Prediction – September 17, 2020
Bitcoin bulls have broken the resistance at $10,800 and $11,000. BTC price is now in the bullish trend zone. Today, BTC is trading at $10,903 at the time of writing. Buyers now have an uphill task to push BTC above $11,700 resistance. A break above the $11,700 resistance will accelerate the price to retest the $12,000 overhead resistance.
Resistance Levels: $10,000, $11, 000, $12,000
Support Levels: $7,000, $6,000, $5,000
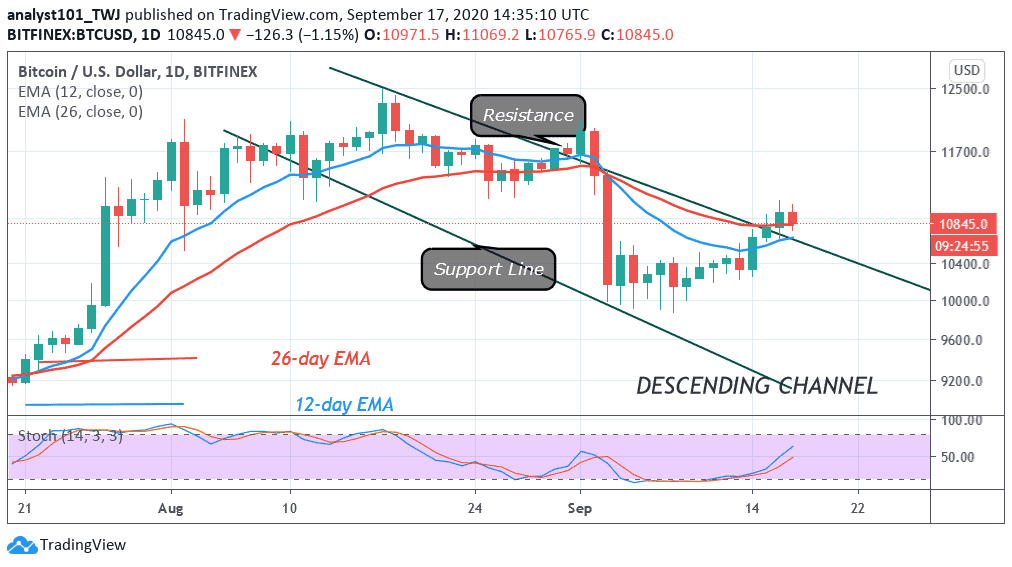
Bitcoin (BTC) was earlier range-bound for almost two weeks between the levels of $10,000 and $10,600. Sellers made several attempts to break below the psychological support but were repelled by a strong buying pressure. Buyers also made attempts to push BTC upward. BTC price became stable above $10,200 before the king coin finally rebounded above $11,200 to reach a high of $10,700. After a minor retracement, buyers pushed the coin above 10,800 but failed to sustain the upward move. Bitcoin bulls have a herculean task to break the resistance at $11,000 and $11,700 to pave the way for a retest at the $12,000 overhead resistance. The uptrend will continue if the bulls sustain price above the $11,000 support. Bitcoin is in a bullish momentum above the 50% range of the daily stochastic.
Bitcoin Sentiment Is at a Record Low in 2020 as Technical Indicator Remains Positive
Reports have it that social media sentiment for Bitcoin has fallen to its lowest in two years. On-chain analytics provider Sentiments takes into account the overall volume of Bitcoin mentioned on Twitter and compares the ratio of positive vs. negative commentary on the platform. The reports have it that the Social sentiment surged a few months ago after Bitcoin recovered following the pandemic-induced market crash in mid-March. In May, June, and July, when Bitcoin was consolidating in the lower $9,000 region, it fell into negative territory again.
In the Bitcoin Fear and Greed Index, the metric is derived from a combination of factors such as volatility, market momentum and volume, social media interaction, market dominance, and current trend. In August, the index was in the “extreme greed” zone at around 80 as Bitcoin traded at a high $11,000 range. In March and April, the index was in the “extreme fear” zone where it reached its lowest level. It is when extreme fear grips global markets.
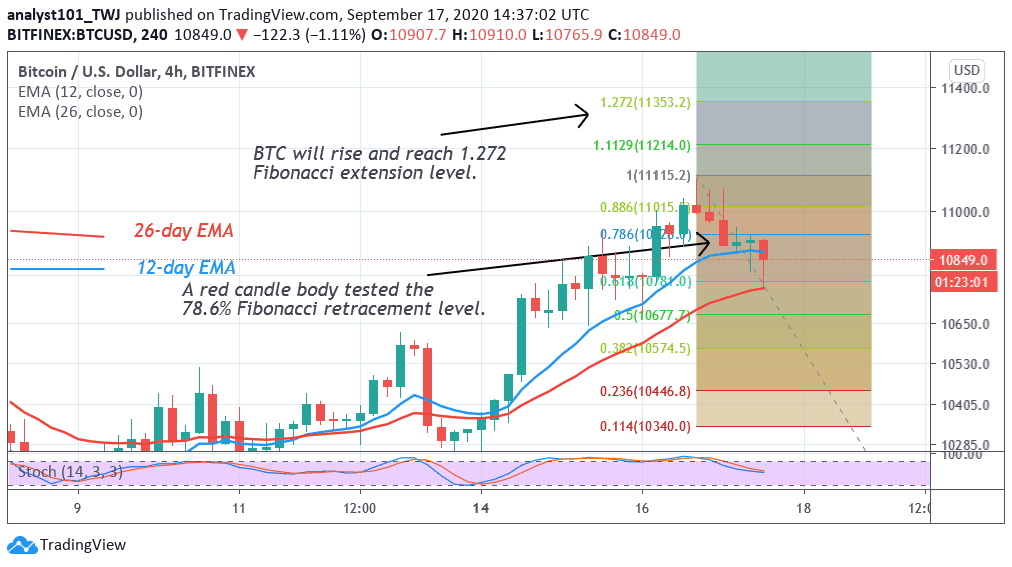
Bitcoin is likely to move up if price breaks above the $11,000 resistance. On September 16 uptrend, BTC reached the $11,000 high but was resisted. The retraced candle body tested the 78.6 % Fibonacci retracement level. It indicates that BTC will rise and reach the 1.272 Fibonacci extension level. That is the high of $11,400.
Join Our Telegram channel to stay up to date on breaking news coverage