


Join Our Telegram channel to stay up to date on breaking news coverage
Bitcoin (BTC) Price Prediction – October 6, 2020
BTC/USD faces rejection at the $10,800 resistance. The downtrend may resume if the bulls fail to push BTC above the current resistance. In September, the bulls made two attempts at the $11,000 resistance but were repelled. The upward movement will be hindered except the $11, 000 resistance is breached.
Resistance Levels: $10,000, $11, 000, $12,000
Support Levels: $7,000, $6,000, $5,000
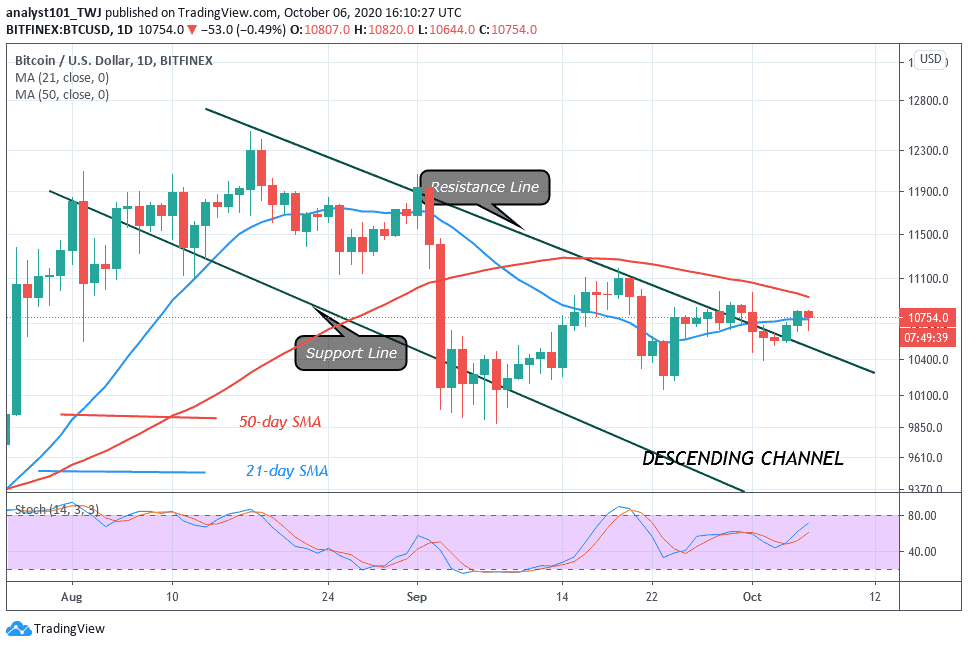
Following the breakdown of October 1, the coin dropped to the low of $10,391 and corrected upward. The price corrected and retested the $10,800 resistance. BTC is on a downward move after a retest at the current resistance. The coin may continue the downward move if the price breaks the support at $10,390. Expectantly, the market will drop to the lows of either $10,200 or $9,800 low.
The downtrend will end, if the $10,400 or $10,200 support level holds. BTC will be compelled to a range-bound movement if the key levels of the market remain unbroken. It is unclear if BTC will encounter a breakdown or a breakout. The advantage is on the side of the bears as the price is in the bearish trend zone.
Bitcoin Technical Indicators Reading
BTC is at level 49 of the Relative Strength Index period 14. It indicates that there is a balance between supply and demand. The price is falling and if breaks below the resistance line, the selling pressure will persist. The SMAs are sloping horizontally indicating the sideways movement of the coin.
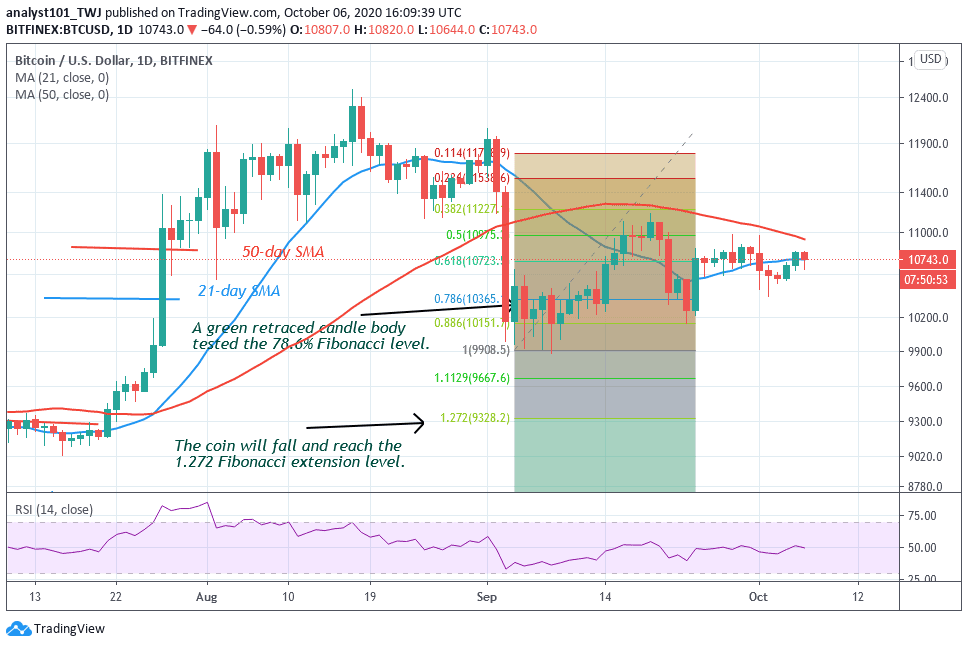
The Fibonacci analysis will not hold if there is a breakout at the $11,000 resistance. On the other hand, it will hold, if the price breaks the $10,000 or $9,800 support level. At the low of $9,990, a green retraced candle body tested the 78.6% Fibonacci level. This implies that the coin will fall and reach the 1.272 Fibonacci extension level or a low of $9,328. The market will reverse after the price reaches the previous low. The reversal will not immediate.
Join Our Telegram channel to stay up to date on breaking news coverage
