Join Our Telegram channel to stay up to date on breaking news coverage
Bitcoin (BTC) Price Prediction – October 10, 2020
BTC/USD rebounds above the $10,560 support as price makes a series of higher highs and higher lows. The uptrend price pattern enables the coin to breach the resistances at $10,800 and $11,000. The coin is now trading at $11,358 at the time of writing.
Resistance Levels: $10,000, $11, 000, $12,000
Support Levels: $7,000, $6,000, $5,000
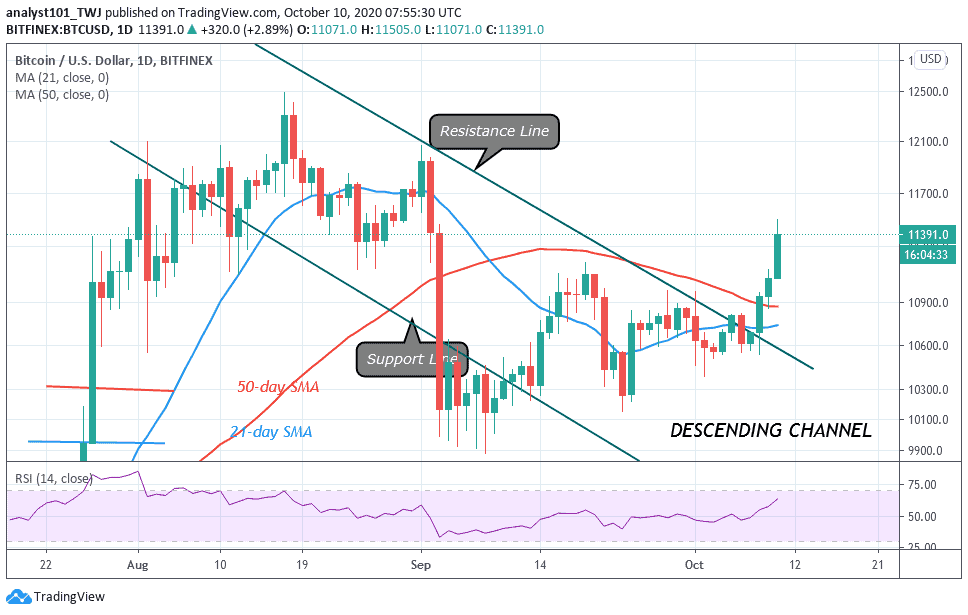
Today, the current uptrend reached a high of $11,500 . After testing the $11,500 resistance, BTC price drops to $11,300 and resumes fluctuation between $11,300 and $11,400. Previously, the $11,100 to $11,300 were support levels when BTC first breach the $12,000 overhead resistance. Buyers used the support levels for upside range trading to retest the $12,000 overhead resistance in September 2020. Today, the levels are now resistance levels to BTC price . The bulls have breached these resistance levels. Buyers have to sustain the current momentum above this resistance for the continuation of the upside momentum. Conversely, if the bulls fail to sustain the current price level, the price will fall below $11,000 resistance.
Bitcoin (BTC) Indicator Reading
Simultaneously, BTC price breaks above the EMAs and the resistance line of the ascending channel. All these indications signify that the BTC price will rise to the previous highs. Given the recent rally to the $11, 500 high, the daily stochastic has indicated that the market is approaching the overbought region. That is, BTC price is above 80% range of the daily stochastic.
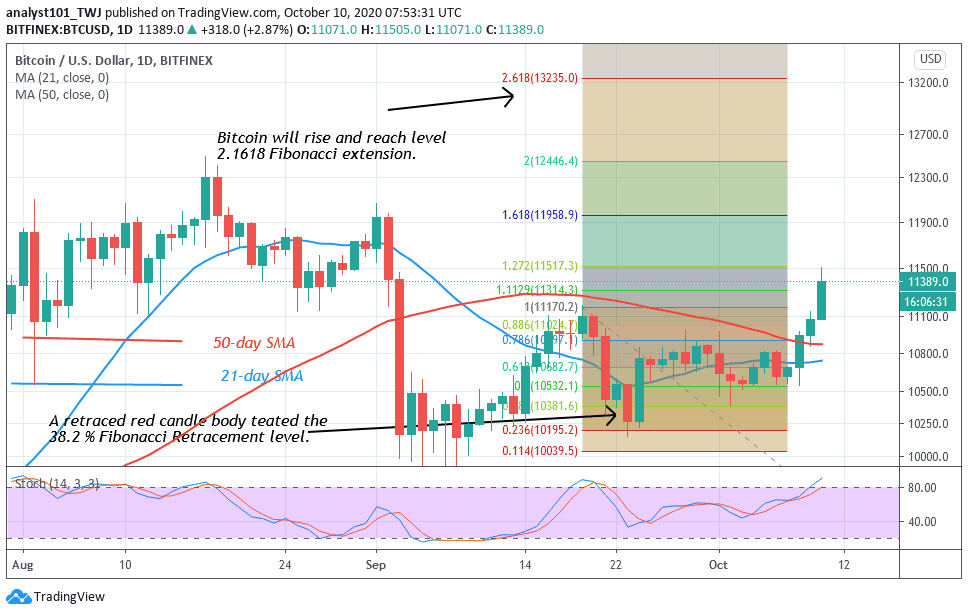
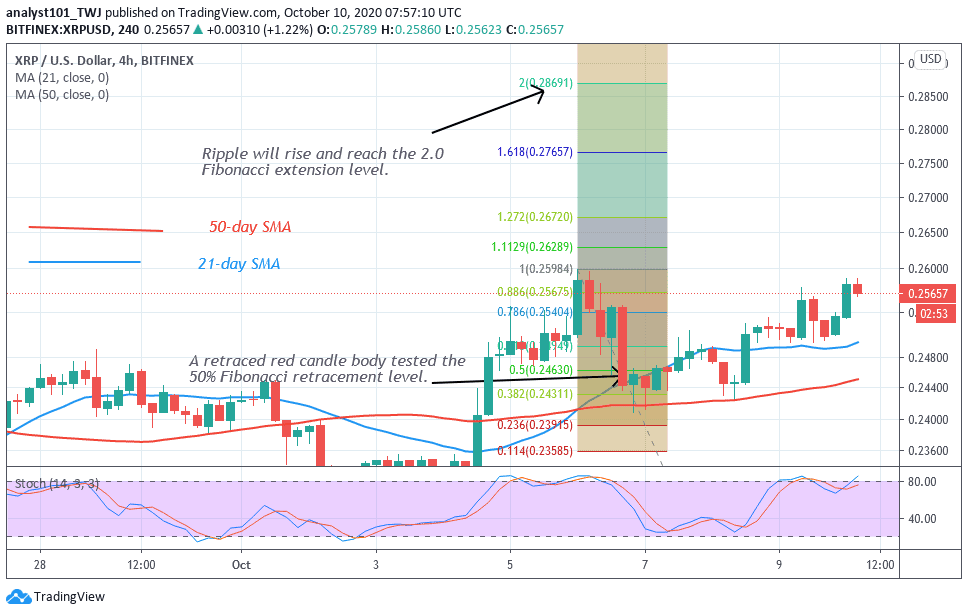
As BTC price approaches the $11,500 high, the market is said to reach the overbought region. In a trending market, the overbought conditions may not hold. On the upside, if BTC price breaks the $12,000 overhead resistance, the Fibonacci tool analysis will hold. That is, as the retraced red candle body tested the 38.2% Fibonacci retracement level, BTC will rise and reach level 2.618 Fibonacci extension. In other words, the coin will reach a high of $13,235.
Join Our Telegram channel to stay up to date on breaking news coverage