

Join Our Telegram channel to stay up to date on breaking news coverage
Bitcoin (BTC) Price Prediction – November 21, 2020
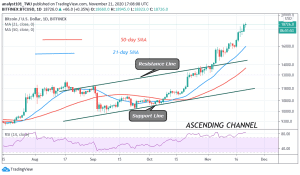
BTC/USD has been on the upside momentum since October after breaking the $12,000 and $12,400 resistance levels. The price level has continued to explode up till the time of writing. At other times there are fears of a possible bearish reaction. For example, the bulls may have breached the resistance level at $15,000. Later a bearish reaction will push the coin downward. Today BTC is trading below the $18,800 resistance.
Resistance Levels: $13,000, $14,000, $15,000
Support Levels: $7,000, $6,000, $5,000

Today, Bitcoin is struggling to break above the $18,800 high. Analysts have presumed BTC will eventually reach the high of $20,000. In recent times, public sentiment has contributed in to rise of Bitcoin. These collective public opinion tend push the coin upward. In the meantime, BTC is struggling below the $19,000 resistance zone. For the past 48 hours the selling pressure has compelled the coin to sideways move below the resistance. The king coin is fluctuating between
Bitcoin (BTC) Indicator Reading
BTC is above the 80% range of the daily stochastic. In the same vein, the crypto is at level 84 of the Relative Strength Index period 14. These indicators have pointed out that Bitcoin is trading in the overbought region of the market. In a trending market, the overbought conditions may not hold, That is the crypto will continue to rise. Nonetheless, if the overbought conditions hold, sellers will emerge to push the coin downward.
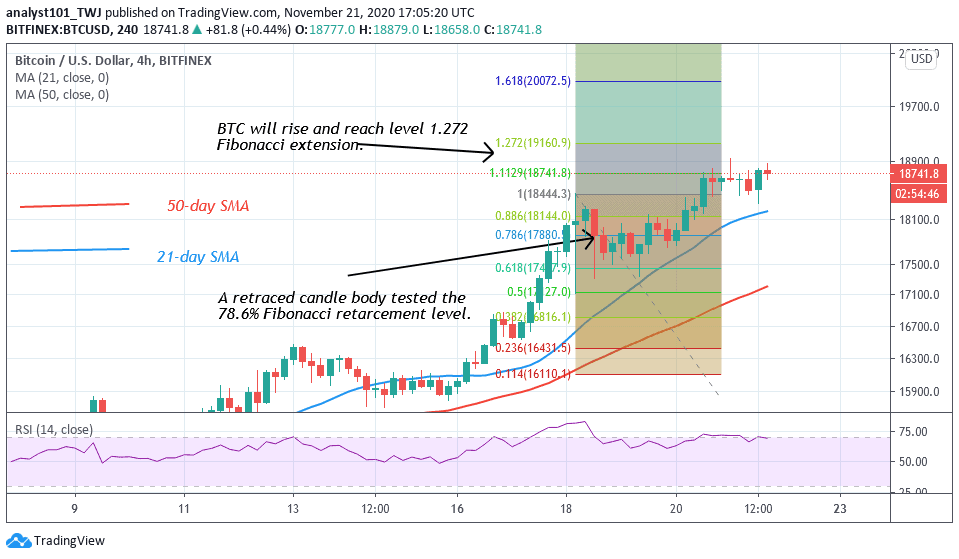
Meanwhile, BTC is fluctuating below the $18,800 high. There has been no significant price movement as the price action has remained the same. On November 18, a retraced candle body tested the 78.6% Fibonacci retracement level. The retracement indicates that Bitcoin will rise and reach level 1.272 Fibonacci extensions or the high of $19,160.90. At this price level, the market is likely to reverse and return to the 78.6% Fibonacci retracement where it originated.
Join Our Telegram channel to stay up to date on breaking news coverage
