Join Our Telegram channel to stay up to date on breaking news coverage
Bitcoin (BTC) Price Prediction – November 21, 2020
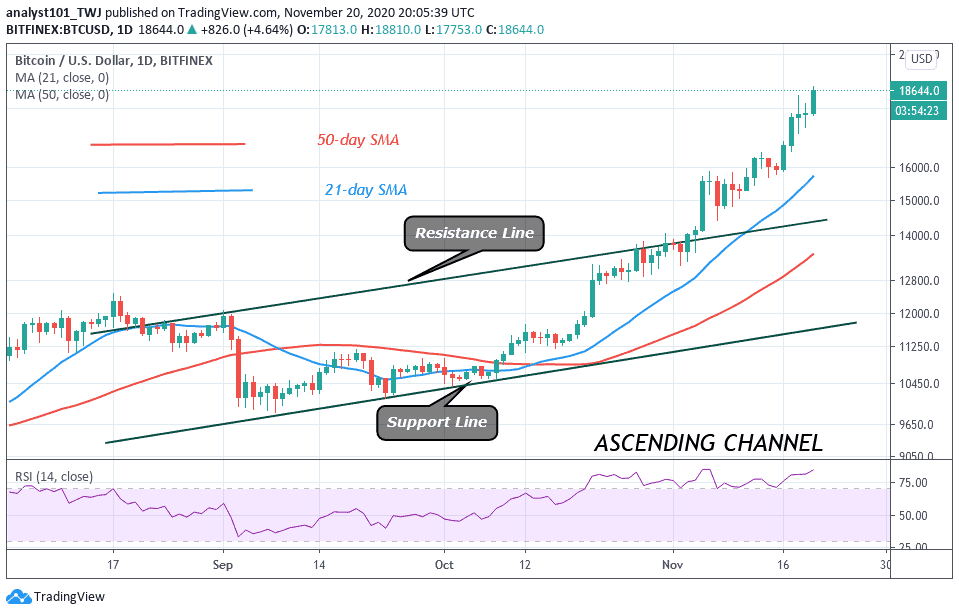
BTC/USD bulls have continued to retest the $18,800 resistance but unable to push above it. The king coin fluctuates in a tight range between $18,400 and $18,800. In a few days to come, the market is likely to encounter a breakout.
Resistance Levels: $13,000, $14,000, $15,000
Support Levels: $7,000, $6,000, $5,000

BTC price is presently consolidating between $18,400 and $18,800. As bulls and bears continue the price tussle in the tight range there is a likelihood of a breakout or breakdown. On the upside, if the bears break the $18,800 resistance, the BTC price will rise to the next resistance at $19,500. On the other hand, if the bears break the lower price range at $18,400, BTC price is likely to fall to the low at $17,800.
Nonetheless, the bulls will buy the dips to push BTC on the upside. As price consolidates near the resistance, the chance of a breakout is likely on the upside. BTC is above the 80% range of the daily stochastic. Similarly, it is at level 84 of the Relative Strength Index period 14. The indicators are pointing out that the coin is in the overbought region of the market. It indicates that BTC is in a strong bullish momentum.
Poloniex Exchange Is on a Brink of Collapse as Bitcoin Surges Higher
Poloniex exchange and others suffer difficulties as Bitcoin surges higher. According to the recent tweet, the reports indicated the following: “Poloniex is currently unavailable due to an unexpected issue,” the exchange’s customer support has indicated. “We are investigating the issue and will keep you updated here throughout.”
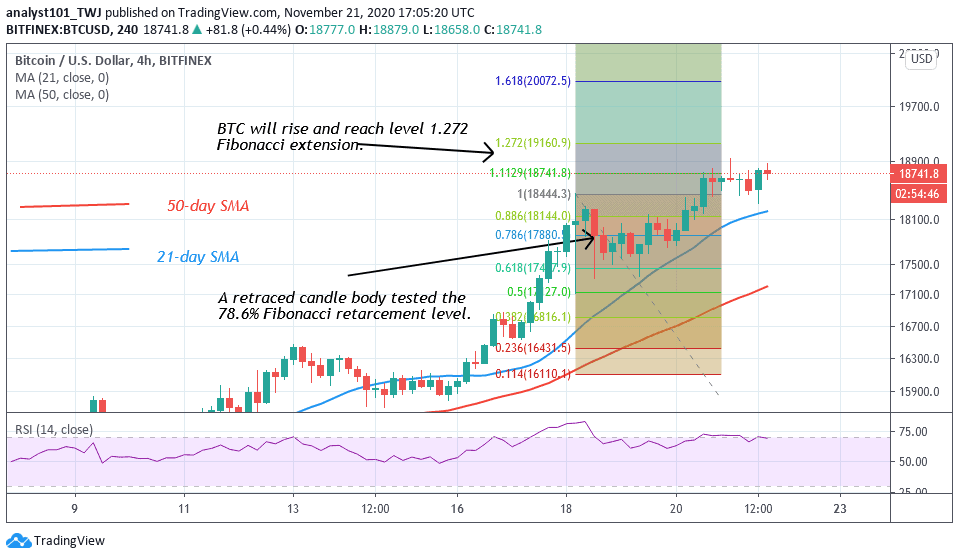
Meanwhile, Bitcoin’s upward move is facing rejection at the $18,800 high. On November 18, a retraced candle body tested the 78.6% Fibonacci retracement level. The retracement indicates that Bitcoin will rise and reach level 1.272 Fibonacci extensions or the high of $19,160.90. At this price level, the market is likely to reverse and return to the 78.6% Fibonacci retracement where it originated.
Join Our Telegram channel to stay up to date on breaking news coverage