Join Our Telegram channel to stay up to date on breaking news coverage
BTC/USD May Lose $47k Support as Further Selling Is Imminent – December 12, 2021
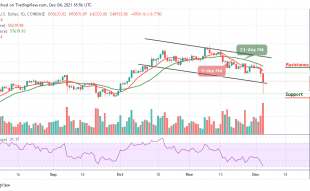
On December 10, BTC/USD fell to the low of $47,051 as further selling is imminent .The $47,000 support has been the crucial support level. The bears have retested the current support on several occasions but fail to break below it. On the other hand, the bulls have retested the $52,000 resistance on one occasion but were repelled.
Resistance Levels: $70,000, $75,000, $80,000
Support Levels: $50,000, $45,000, $40,000

Today, Bitcoin’s (BTC) price has continued to make an upward move to the previous highs. The brief uptrend reached the high of $50,800 but was repelled. Bitcoin selling pressure has resumed as price declines to revisit the lower price range. This has been the price action since the December 4 price collapse. On December 4 price breakdown, Bitcoin plunged to $41,634 as bulls bought the dips. The price corrected upward to the high of $51,970. The upward correction was terminated as Bitcoin slumped again to the low of $47, 051. Nevertheless, for the past week, BTC/USD has been range-bound between $47,000 and $52,000. Bitcoin will resume down trending or up trending when the range-bound levels are breached.
Bitcoin (BTC) Indicator Reading
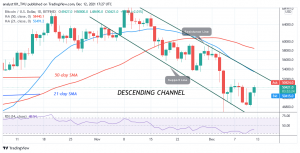
Bitcoin is at level 39 of the Relative Strength Index for period 14. It indicates that the crypto is trading in the downtrend zone and capable of falling on the downside.BTC price bars are below the moving averages which indicate that Bitcoin is in the bearish trend zone where prices can fall. The king coin is below the 50% range of the daily stochastic. The market has resumed bearish momentum.
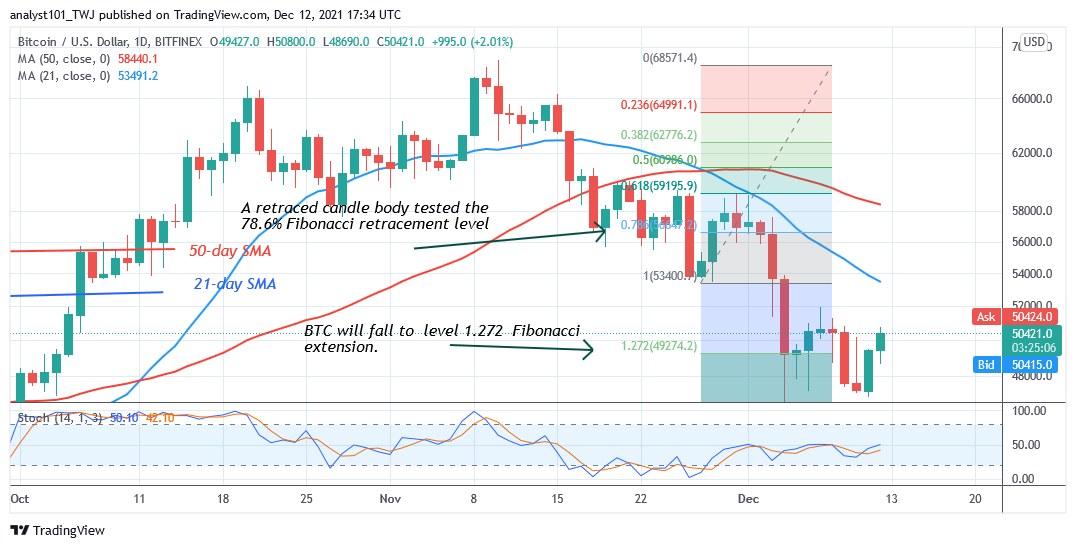
Meanwhile, BTC’s price is hovering above the crucial support at $47,000 as further selling is imminent. The price movement is restricted between $47,000 and $50,500. This tight range will eventually lead to a breakout or a breakdown of prices. Meanwhile, on November 26 downtrend; a retraced candle body tested the 78.6% Fibonacci retracement level. The retracement indicates that BTC price will fall but reverse at level 1.272 Fibonacci extension or $49,274.20.
Looking to buy or trade Bitcoin (BTC) now? Invest at eToro!
68% of retail investor accounts lose money when trading CFDs with this provider
Read more:
• How to buy cryptocurrency
• How to buy Bitcoin
Join Our Telegram channel to stay up to date on breaking news coverage