Join Our Telegram channel to stay up to date on breaking news coverage
Bitcoin (BTC) Price Prediction – April 29, 2021
Bitcoin faces rejection from the $56,000 resistance zone after three days of fluctuating below it. Bitcoin is in a downward move after rejection from the recent high. The bears have also broken the $54,000 support level which is an indication of a further downward move.
Resistance Levels: $65,000, $70,000, $75,000
Support Levels: $50,000, $45,000, $40,000

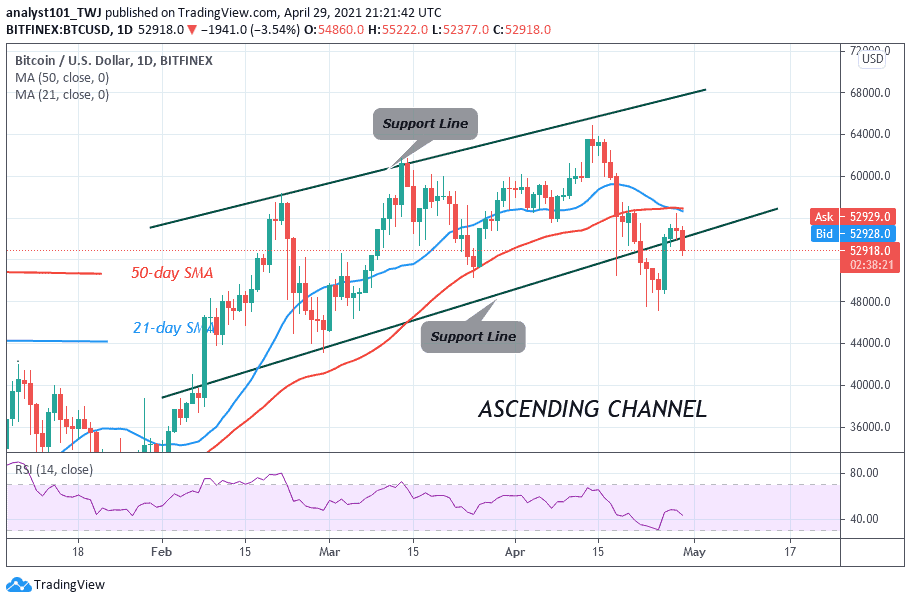
Following a stiff resistance at the $56,000 high, Bitcoin has dropped sharply to $52,000 low. The downtrend was accelerated because the bears broke the $54,000 supports. As price breaks the $54,000 support there is every indication that the decline will continue to the previous low at $48,000 support. BTC/USD will undergo an acid test above the $48,000 support. The bulls have been defending the support level since February 22. The bears attempting to break the psychological price level which will pave the way for a further downtrend. However, if Bitcoin loses the $48,000 support, the BTC price will fall into a deeper correction. Buyers have lost the $54,000 support; therefore there is a likelihood of a further downtrend. Today, Bitcoin is trading at $52,896.10 at the time of writing.
Bitcoin (BTC) Indicator Reading
Bitcoin is at level 44 of the Relative Strength Index period 14. It indicates that BTC price is in the downtrend zone and capable of falling on the downside. The king coin has fallen below the 20% range of the daily stochastic. This implies the crypto has fallen into the oversold region of the market. In the oversold region, there is likely to be the emergence of buyers to push prices upward. The crypto’s price is breaking below the support line of the ascending channel. The selling pressure will resume if price breaks and closes below it.

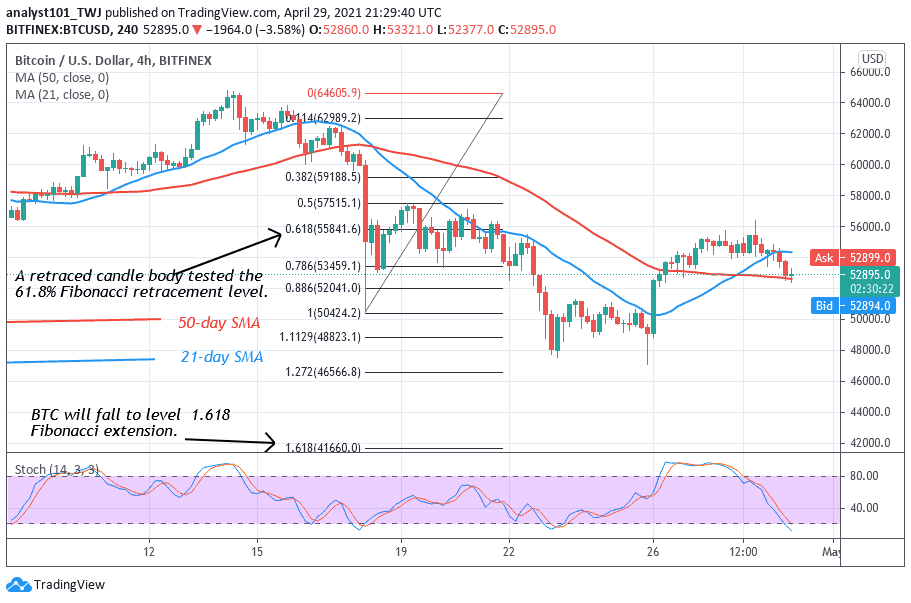
On the 4-hour chart, the BTC price has fallen to the support of the 50-day SMA. If the support holds, the uptrend will resume. Nevertheless, if the bears break the $48,000 support, the price action may retest the Fibonacci levels. That is, on April 18 downtrend; a retraced candle body tested the 61.8% Fibonacci retracement level. This retracement indicates that Bitcoin will fall to level 1.618 Fibonacci extension or the low of $41,660.00.
Join Our Telegram channel to stay up to date on breaking news coverage

