Join Our Telegram channel to stay up to date on breaking news coverage
ETH Price Prediction – April 29
The Ethereum bulls scatter as sellers swing into action amid calls for revenge, the bearish action targets resistance turned support at $2680.
ETH/USD Market
Key Levels:
Resistance levels: $3000, $3100, $3200
Support levels: $2500, $2400, $2300
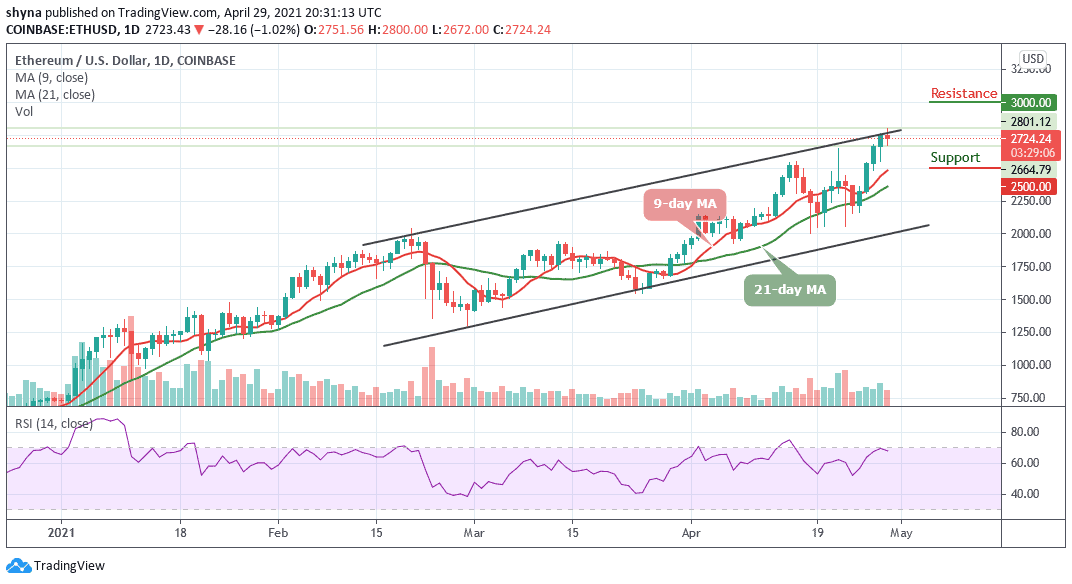
At the time of writing, ETH/USD is trading down 1.02% at its current price of $2724.24, which marks a notable decline from its daily high of $2800 that was set today when the bulls attempted to spark another rally. In the near term, ETH/USD has been able to find some support in the lower $2672 level, as the market price remains firmed above the 9-day and 21-day moving averages.
Where is ETH Price Going Next?
The Ethereum price is trading near the upper boundary of the channel, waiting for a cross above the channel. Meanwhile, Ethereum’s immediate upside is limited by the channel currently at $2724. However, the coin may need to move above this pivotal level at $2700 may continue to give the buyers sleepless nights. However, a break above the resistance could most likely give the second-largest crypto a boost above $2800 before reaching the important resistance at $3000, $3100, and $3200 levels.
On the downside, The RSI (14) has a bearish feel after retreating from highs around 70-level. The first support lies at $2600 this is after $2650 failed to hold in the session after opening today. If this level is also cleared, Ethereum could revisit $2550 support. More so, the critical support levels are located at $2500, $2400, and $2300 which are below the moving averages.
When compares with BTC, ETH is still trading well above the 9-day and 21-day moving averages and the price is now hovering at 5110 SAT as the technical indicator RSI (14) swims within the overbought zone. However, bulls remain the dominant of the market at the moment as the pair seems to be moving around the upper boundary of the channel.
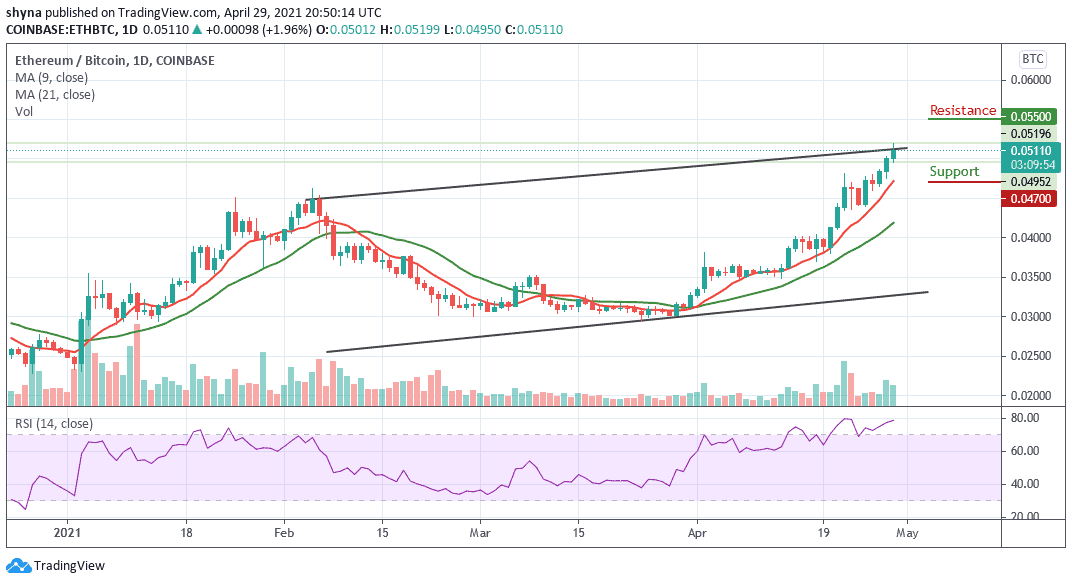
On the upside, the resistance levels to be reached are found above the ascending channel at 5500 SAT and 5700 SAT. However, a lower sustainable move may likely cancel the bullish pattern and this could attract a new seller to the market with the next focus at 4700 SAT and 4500 SAT.
Join Our Telegram channel to stay up to date on breaking news coverage