Join Our Telegram channel to stay up to date on breaking news coverage
Binance Coin Price Prediction – May 29
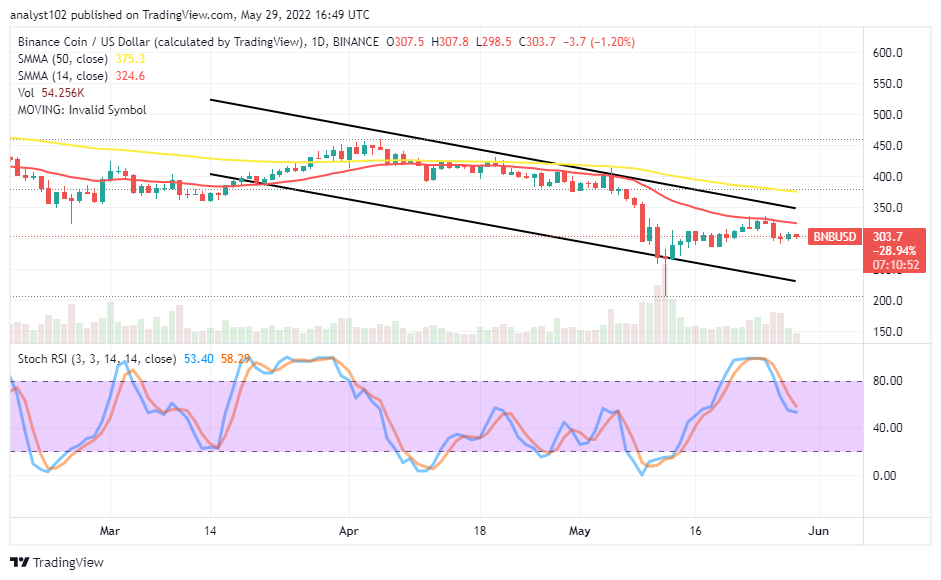
The BNB/USD market operation hits a resistance point as the smaller SMA trend line has been instrumental in the trending determination over time. The depression inflicted on the Binance Coin market valuation by the US Dollar is estimated at around -1.20% as it trades at the $303 value line.
Binance Coin Price Statistics:
BNB price now – $307.58
BNB market cap – $50.2billion
BNB circulating supply – 163.3 million
BNB total supply – 163.3 million
Coinmarketcap ranking – #5
Binance Coin Market
Key Levels:
Resistance levels: $350, $370, $390
Support levels: $250, $230, $220 BNB /USD – Daily Chart
The daily chart showcases the BNB/USD trade hits a resistance around the smaller SMA trend line. The 50-day SMA indicator is above the 14-day SMA indicator. A line of candlesticks has formed in a range bound between the downward channels drawn. The Stochastic Oscillators have crossed southbound from the overbought region to reach a range of around 50. And they are seemingly trying to close the lines back to signify a pause to featuring active moves for a while.
Is any advantage in the current BNB/USD market range-trading outlook?
It requires efforts for traders to have the BNB/USD market range-trading outlook. Range-bound trading has a two-way dimensional approach which has to do with either of the ranging lines to determine a buying order or a sell that has to out of breaking or a reversal at either level to decide position entry afterward. Intending traders wishing to go long on this market needed to let there be some pulling downs toward the trend line of the lower bearish channel before exerting a buying order.
On the downside of the technical analysis, the downward forces to the downside direction are still gathering closely underneath the trend line of the 14-day SMA. Sellers will have to increase efforts against any possible breakout around the $350 resistance level. Traders have to always back up their entries with price actions to ensure their position entry into a profit-generating moment at an early stage.
BNB/BTC Price Analysis
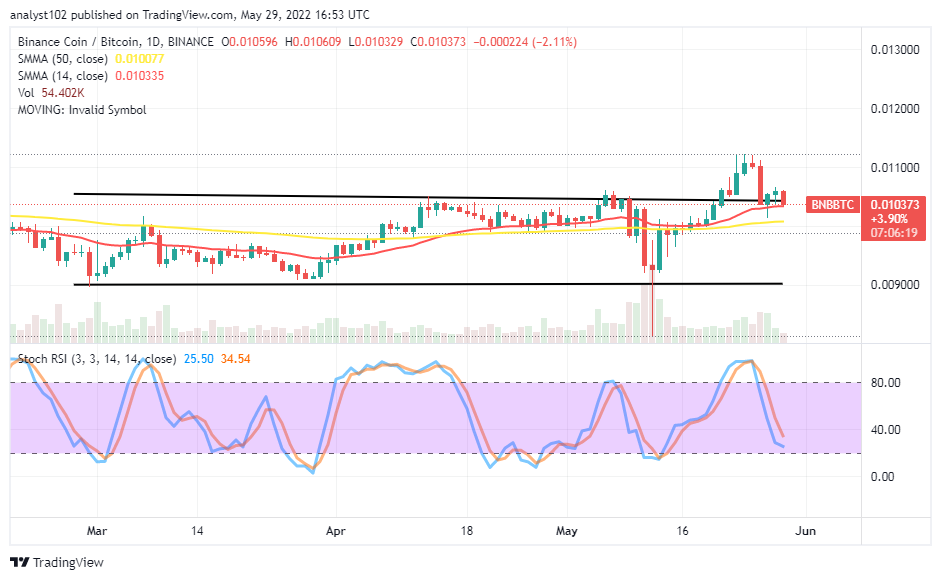
In comparison, Binance Coin appears to maintain a higher-trading level against Bitcoin. The 14-day SMA indicator has intercepted the 50-day SMA indicator. The dominating trend appears to be in range-bound trading zones. The Stochastic Oscillators have crossed southbound toward the range of 20. The situation reveals the base crypto isn’t down against the trending capacity of the flagship-countering crypto economy.
Read more:
Join Our Telegram channel to stay up to date on breaking news coverage


