Join Our Telegram channel to stay up to date on breaking news coverage
BCOUSD Price Analysis – June 09
After the pullback, there is tendency for the Brent crude oil price to decrease further towards $58 level should the Bulls maintain or increase their pressure. In case the Bulls gain enough momentum to break up the $64 level and the candle closes above the level, the price may rally towards $70 level.
BCO/USD Market
Key levels:
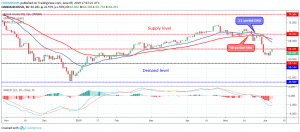
Supply levels: $64, $70, $79
Demand levels: $58, $49, $41
BCOUSD Long-term trend: Bearish
On the long-term outlook, Brent Crude Oil is bearish. Last week, the Brent crude oil price initially decreased towards $58 demand level. Later, towards the end of last week, the Bulls pushed the price back to retest the broken level of $64 before the continuation of the bearish trend. The Brent crude oil price is at the supply level of $64 and that is where the market closed last week.
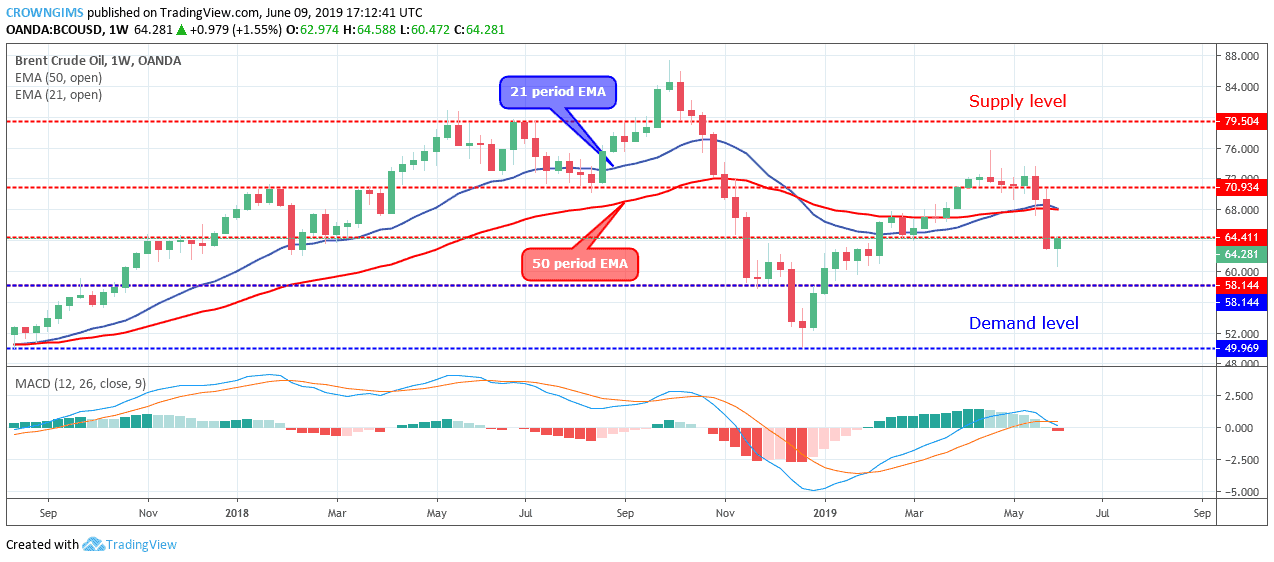
The 21 period EMA is about crossing the 50 periods EMA downside to confirm the bearish movement. The commodity is trading below the two EMAs as a sign of bearish momentum. The histogram of the Moving Average Convergence Divergence period 12 has crossed below the zero levels and the signal line is crossing the MACD line to indicate a continuation of bearish momentum. After the pullback, there is a tendency for the Brent crude oil price to decrease further towards $58 level should the Bulls maintain or increase their pressure.
BCOUSD medium-term Trend: Bearish
Brent Crude Oil is bearish on the daily chart. The bearish momentum pushed the Brent Crude Oil price to break down the former demand level of $64 last week. The price decreased further targeting $58 level but unable to reach the mark before the Bulls interrupted. The price turned as a pullback to touch the $64 level on June 06. In case the Bulls gain enough momentum to break up the $64 level and the candle closes above the level, the price may rally towards $70 level.
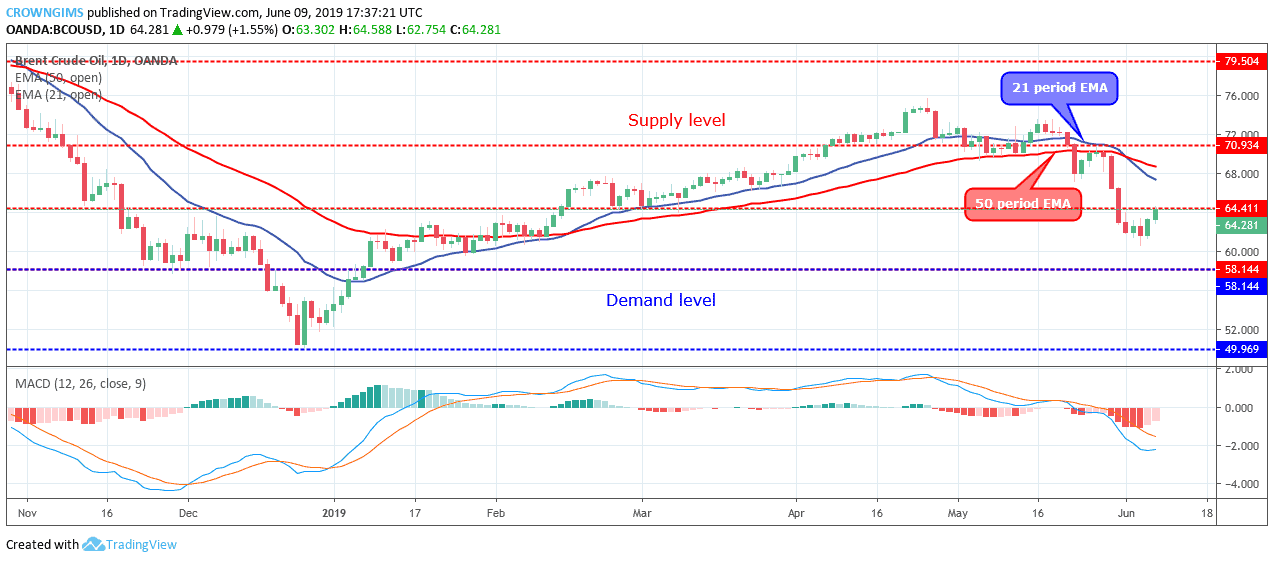
Meanwhile, the Moving Average Convergence Divergence with its histogram is below zero levels and the signal lines bending down to indicate sell signal.
Please note: insidebitcoins.com is not a financial advisor. Do your own research before investing your funds in any financial asset or presented product or event. We are not responsible for your investing results.
Join Our Telegram channel to stay up to date on breaking news coverage