Join Our Telegram channel to stay up to date on breaking news coverage
BCH Price Prediction – March 28
BCH/USD trades at the lowest price in the past 10 days as the coin swings in the strong selling zone.
BCH/USD Market
Key Levels:
Resistance levels: $550, $570, $590
Support levels: $450, $430, $410
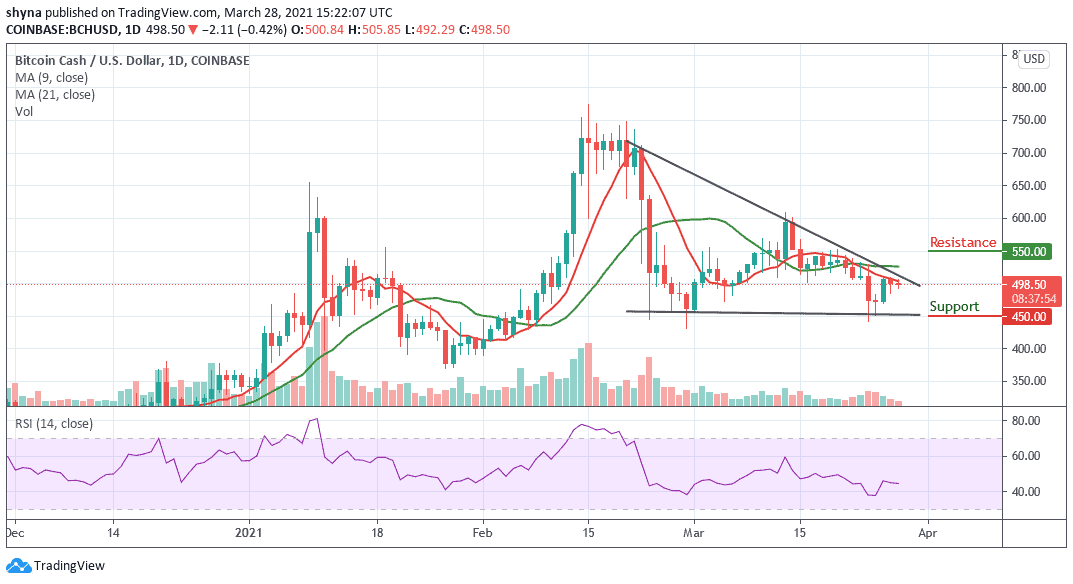
Since the past few days, most of the major coins of the crypto market have been recording losses for quite some time now. Similarly, BCH/USD price is crashing down even harder as it currently trades at $498.50. The price trend of BCH is having more inversely trading red candles leading to loss-making investments.
What to Expect from BCH
Analyzing the daily movement of BCH/USD for the past 10 days, we see that the coin continues to move at the lower side at $498.50, after which it recorded a higher high a couple of days ago. BCH/USD has been unable to hold the volatility; the downtrend led the coin to trade below $500, recording a fall of 0.42% as the RSI (14) moves around 45-level.
However, BCH/USD is changing hands at $498.50 and if the market price drops further, the coin could slump to the support levels of $450, $430, and $410, bringing the price to a new monthly low. Meanwhile, a strong buying pressure may push the price above the 9-day and 21-day moving averages. While trading above the channel, a bullish continuation is likely to touch the $550, $570, and $590 resistance levels.
Comparing with Bitcoin, BCH performance has been very low due to a recurring bearish sentiment which has caused the market to fall drastically. As the price falls, sellers are posing an additional threat for buyers to reach the support level of 0.086 BTC where the nearest target is located. However, an eventual break below the lower side of the channel may cause the coin to collapse more.
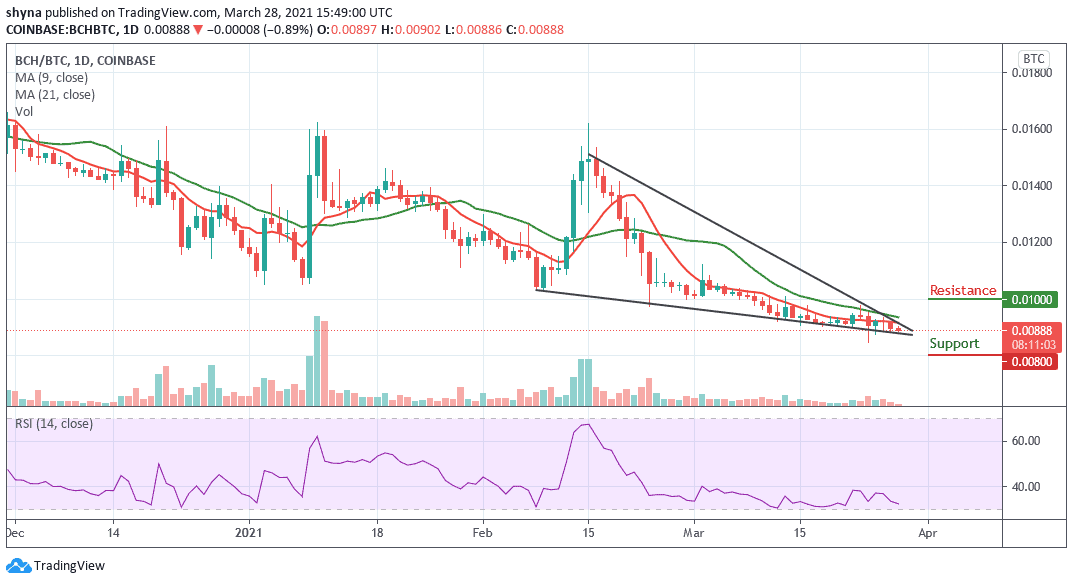
However, for a positive upsurge, the 0.010 BTC and above are the major resistance levels for the coin for now. Therefore, a negative spike could retest the important support at the 00.008 BTC and below. The trading volume is fading away as the RSI (14) may be entering into the oversold zone.
Join Our Telegram channel to stay up to date on breaking news coverage