Join Our Telegram channel to stay up to date on breaking news coverage
BCH Price Prediction – January 16
For the past few days now, BCH/USD price actions have been consolidating around the 9-day moving average.
BCH/USD Market
Key Levels:
Resistance levels: $600, $650, $700
Support levels: $350, $300, $250
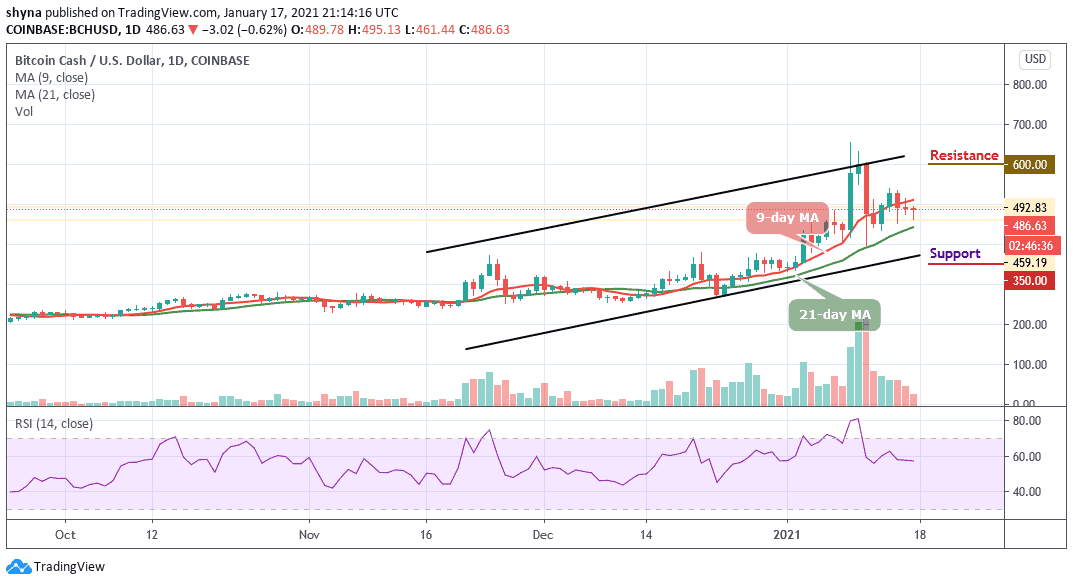
BCH/USD is now struggling with the bearish pressure that dominates the entire crypto landscape. A few actions were witnessed to the upside over the past few days. However, the zone between $450 and $550 stayed intact as the key support level. The bulls are keen to ensure that the price stays above the moving averages before today’s dips into the $461 support zone.
Where is BCH Price Going Next?
Despite the fact that the BCH price moved above the 9-day MA yesterday, the coin has not been able to maintain its performance as it begins to recede downwards. At the moment, BCH/USD is moving within the 9-day and 21-day moving averages but the present trend indicates that BCH prices may continue to move sideways as the technical indicator RSI (14) moves below the 60-level.
In addition, if the BCH market drives below the lower boundary of the channel, the market price could slump to the supports at $350, $300, and $250, bringing the price to a new monthly low as the technical indicator moves in the same direction. Meanwhile, if the bulls can push the coin above the 9-day MA, a very strong buying pressure may likely take the price to $550 resistance. While trading at this level, a bullish continuation could touch the resistance levels at $600, $650, and $700 respectively.
When compares with BTC, the BCH price continues to follow a sideways movement trading below the 9-day moving average. BCH/BTC may likely go below this range if the sellers keep on pumping more pressure into the market.
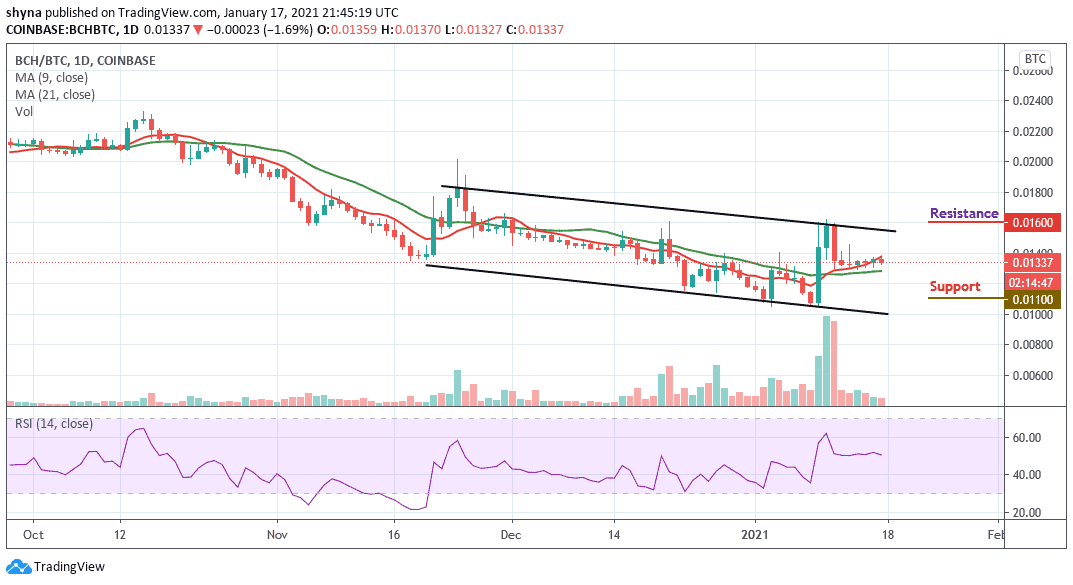
However, the market price may likely resume an upward trend if the bulls push the market price above the 9-day and 21-day moving averages to hit the resistance level of 1600 SAT and above. More so, as the RSI (14) moves below 51-level, a retest could lower the price of the coin to the supports of the 1100 SAT and below.
Join Our Telegram channel to stay up to date on breaking news coverage