Join Our Telegram channel to stay up to date on breaking news coverage
BCH Price Prediction – January 5
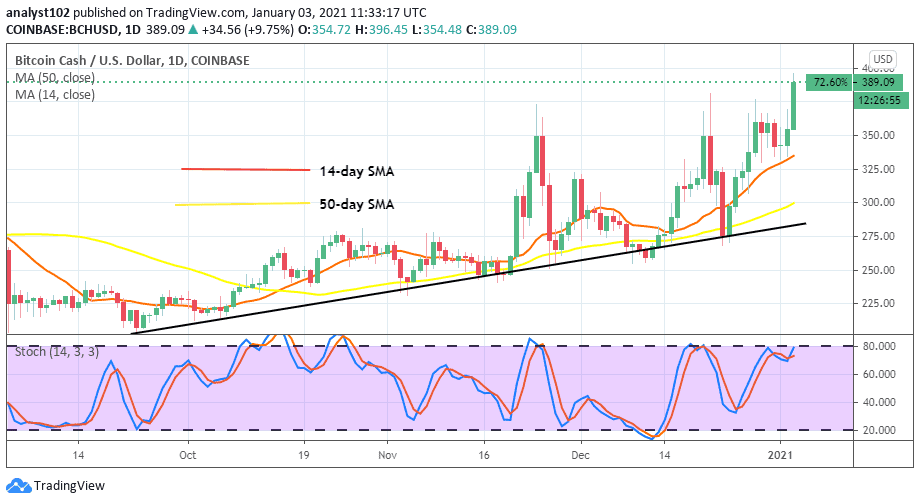
Bitcoin Cash shows an amazing intraday hike as it rises from today’s low of $389 to touch the daily high at $426.
BCH/USD Market
Key Levels:
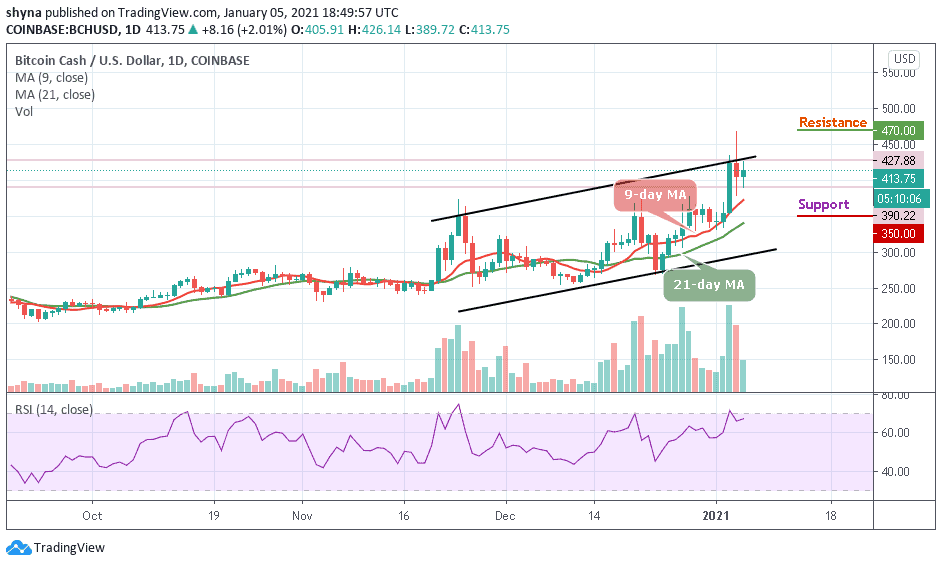
Resistance levels: $470, $490, $510
Support levels: $350, $330, $310
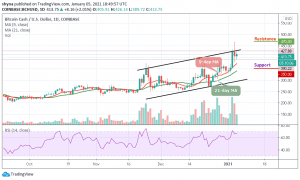
BCH/USD is currently trading above the 9-day and 21-day moving averages. The coin is hovering at $413 after touching the daily high at $426.14. The Bitcoin Cash is expected to break above the upper boundary of the channel to touch the resistance level of $450. However, the coin gains 2.01% within 24 hours as it is using $380 support as a jumping-off ground to develop the upside momentum, which is now gaining traction.
What to Expect from Bitcoin Cash (BCH)
On the upside, if BCH/USD continue to move above the 9-day and 21-day moving averages, the market price may likely break into another resistance at $460. Meanwhile, the technical indicator may show that the bulls are ready for action especially if the RSI (14) crosses above the 70-level. Any further bullish movement may pave the way to the resistance levels of $470, $490, and 510.
In other words, should in case the market price falls below the moving averages, BCH/USD may be compelled either to a range-bound or begin a downward movement. This could serve as a major blow for the market sentiments as traders may interpret it as a sign of underlying weakness. The next available support may come at $370, which could be followed by $350, $330, and $310 support levels.
When compares with Bitcoin, BCH is still following the downtrend as the sellers are gaining the market under the 9-day and 21-day moving averages falling towards the lower boundary of the channel while the technical indicator RSI (14) is attempting to cross below the 40-level.
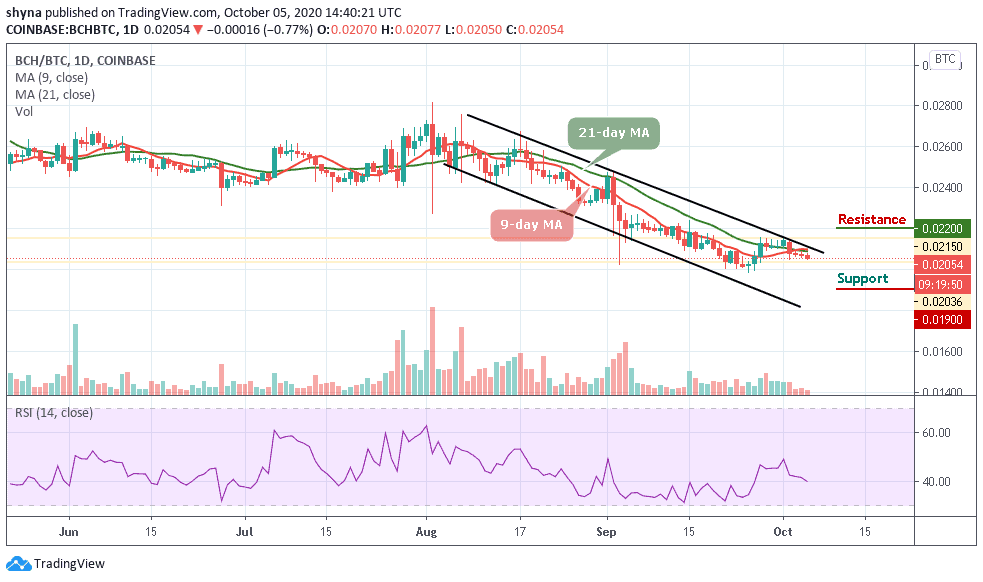
However, if the bears succeeded in breaking below the channel, BCH price may likely fall to the support level of 1000 SAT and below. Meanwhile, a rebound could push the price above the moving averages and increase it to the resistance level of 1500 SAT and above.
Join Our Telegram channel to stay up to date on breaking news coverage