Join Our Telegram channel to stay up to date on breaking news coverage
BCH Price Prediction – November 9
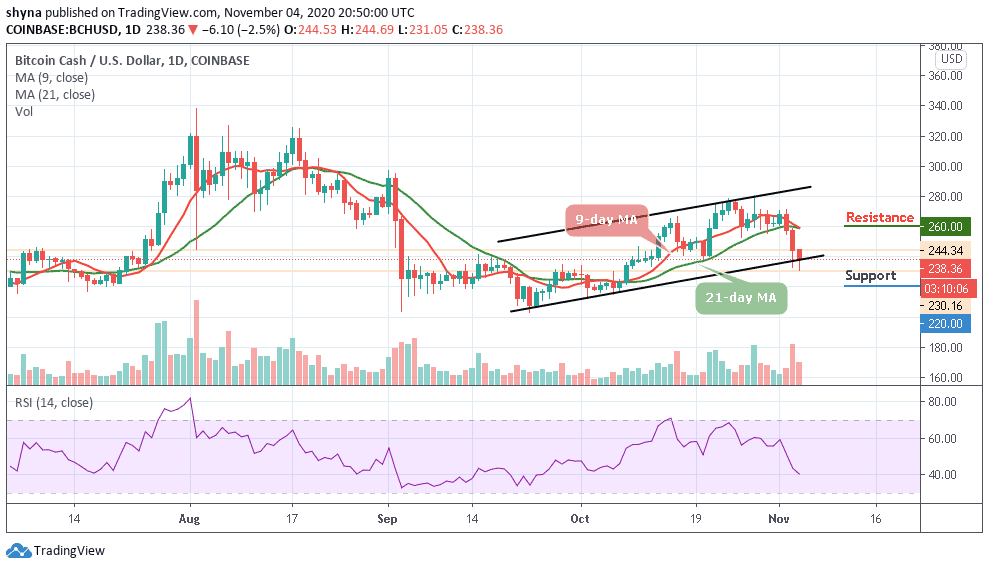
The Bitcoin Cash eyes support at $250 after losing over 3.04% of its value on the daily trading.
BCH/USD Market
Key Levels:
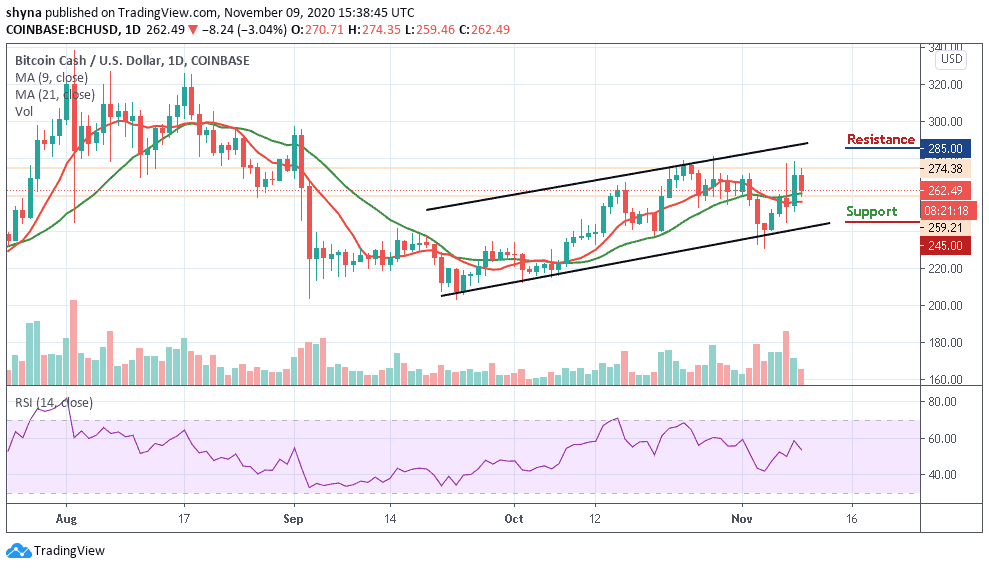
Resistance levels: $285, $295, $305
Support levels: $245, $235, $225
BCH/USD has been trading with very low volatility as its traders appeared to be waiting on the sidelines for the market to make a move. For the past few days, the price of BCH has been oscillating between $231 and $278, with the buyers and sellers equally strong. Meanwhile, the market price is seen crossing below the 21-day moving average within the channel.
Where is BCH Price Going Next?
At the time of writing, the coin may be following the downtrend as the red-line of 9-day MA is seen crossing below the green-line of 21-day MA. Meanwhile, if the lower boundary of the channel were to expand in the subsequent sessions, alongside the trading volumes, it is likely that a break-out to the downside could be confirmed. However, while trading below this barrier, a bearish continuation may likely bring the price to the supports of $245, $235, and $225.
Nevertheless, if the bulls hold the current value and push the price above the resistance level of $280, any further bullish movement towards the upper boundary of the channel could push the coin to the resistance levels of $285, $295, and $305. Presently, the technical indicator RSI (14) is seen moving below the 40-level, suggesting that a possible bearish movement may come into play.
When compares with Bitcoin, the BCH price is currently following the downtrend as the sellers gain momentum below the 9-day and 21-day moving averages around the lower boundary of the channel while the RSI (14) moves below the 40-level to keep the coin on the negative side.
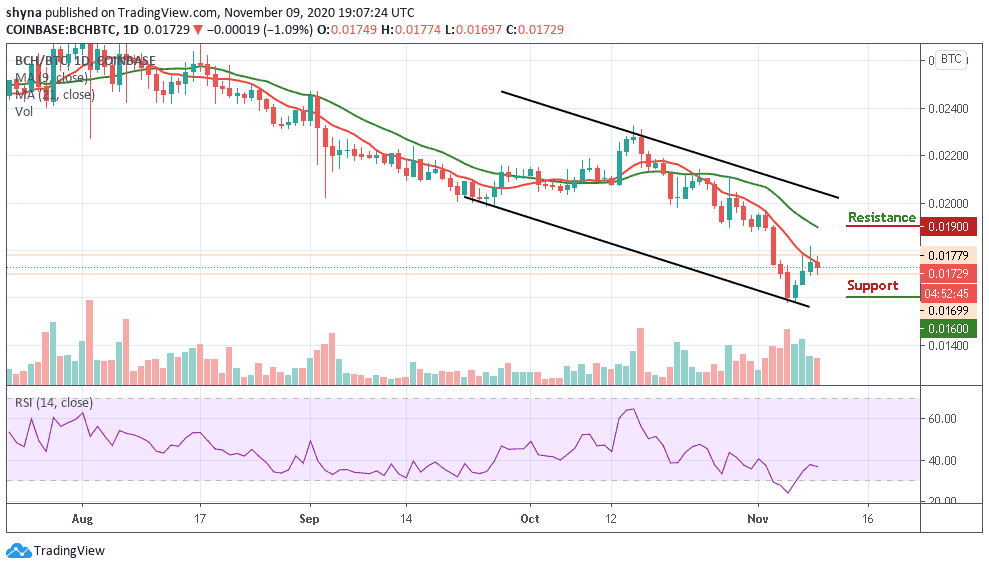
Furthermore, the sellers are seen put more pressure in order to increase their entries. More so, in case the bears succeeded in breaking below the lower boundary of the channel, traders would expect the market to fall to the support level of 0.0160 BTC and below. Meanwhile, a rebound may increase it to the resistance level of 0.190 BTC and above.
Read more:
- Monero (XMR) Price May Close Below $142 Level, Tamadoge Jumps Northwards
- Ethereum Price Prediction – ETH/USD Makes a Quick Return to $175
Join Our Telegram channel to stay up to date on breaking news coverage