
Join Our Telegram channel to stay up to date on breaking news coverage
BCH Price Prediction – November 4
At the time of writing, Bitcoin Cash is witnessing a rise in its selling pressure as the crypto’s bearishness hinted towards a downward price action.
BCH/USD Market
Key Levels:
Resistance levels: $260, $270, $280
Support levels: $220, $210, $200
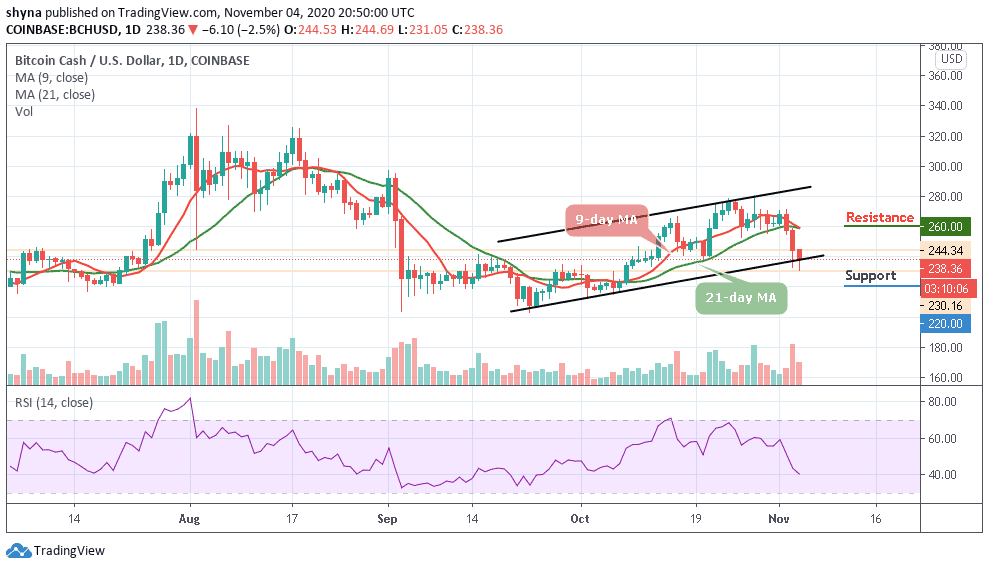
A few days ago, BCH/USD peaked at $240 and has been following a downward trend within the channel. However, the price not staying above $220 ruins the long-term technical picture of the coin. BCH/USD will have to hold this ground to guide against the further downward pressure as the closest support expects the coin at $220.
Where is BCH Price Going Next?
Today, Bitcoin Cash price spotted at $231 after a bearish candlestick crossing below the lower boundary of the channel. It was at the onset at the beginning month when BCH/USD was seen breaching $260 and even $232 but failed to trade persistently and corrected downwards. At this point in time, Bitcoin Cash is losing over 2.5% value and has, therefore, led to take support from 21-day daily MA.
However, the volatile price movement remains intact, and we expect a breakdown soon as per the current formation of the moving averages. Alongside, the bearish crossover happened on the RSI (14) chart as the candlewick pulled back and move below the channel. The RSI (14) is seen crossing below the oversold region and currently lies at $260, $240, and $245.
Against Bitcoin, the Bitcoin Cash is currently trading below the 9-day and 21-day moving averages and the daily chart reveals that the bears are showing a great commitment to the trading. Meanwhile, looking at the recent negative signs, the market price may continue to go down if the sellers continue to pump more pressure into the market.
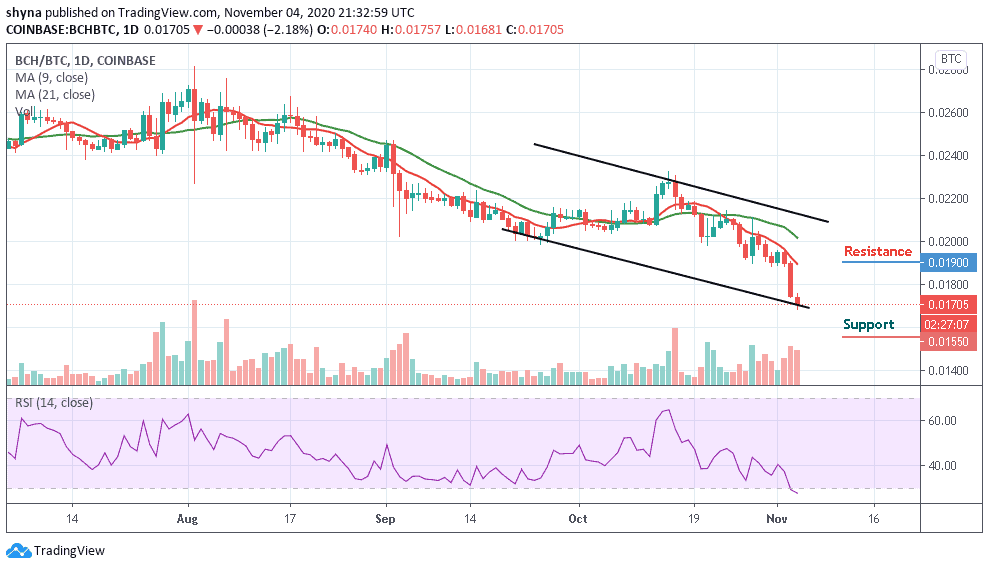
However, as the RSI (14) signal line nosedives below 40-level, if the buyers could successfully hold the support of 0.1700 BTC, the market price may likely begin an upward movement, while pushing further above the moving averages may cause it to the resistance level of 0.019 BTC and above but a retest could lower the price to the supports of 0.0155 BTC and below as the RSI (14) moves into the oversold movement.
Join Our Telegram channel to stay up to date on breaking news coverage
