Join Our Telegram channel to stay up to date on breaking news coverage
BCH Price Prediction – October 7
Bitcoin Cash struggles to stay above the moving averages as the coin is likely to settle in consolidation for the short term.
BCH/USD Market
Key Levels:
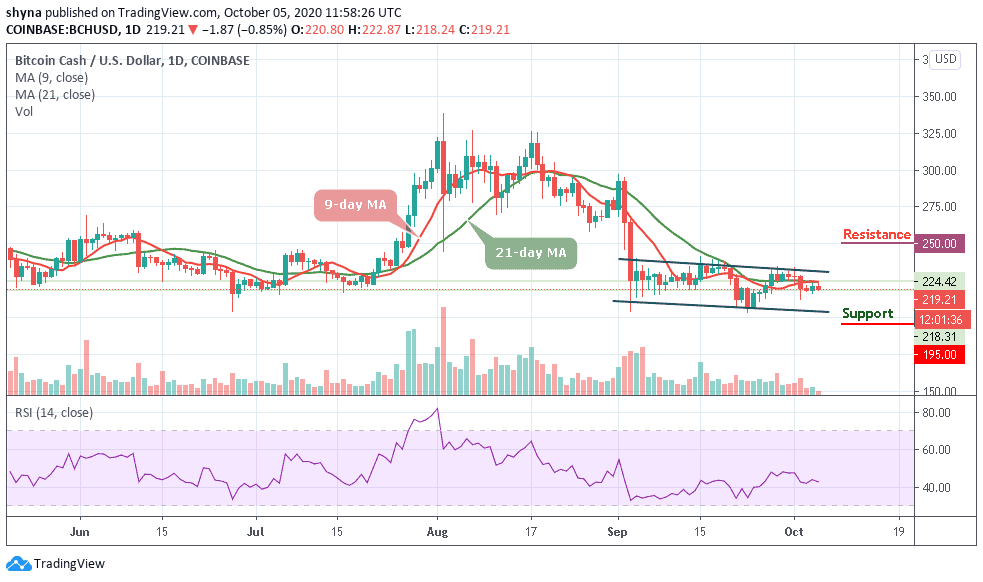
Resistance levels: $240, $250, $260
Support levels: $200, $190, $180

At the time of writing, BCH/USD is pushing for consolidation around $220 but the trend has a bearish inclination, which may likely test the support at $210 as it moves below the 9-day and 21-day moving averages. However, the technical indicator has remained bearish as the RSI (14) continues to move below the 45-level which reflects the influence the sellers have over the price.
Where is BCH Price Going Next?
As the daily chart reveals, the best the bulls can do is to defend the support at $215 and focus on pulling above the moving averages. Yesterday, the Bitcoin Cash lost balance alongside other cryptos and the sharp drop affected the buyers from an attempted recovery above $230. However, BCH/USD is making an effort to jump above the moving averages and it is also looking forward to reclaiming the ground past $224.
Presently, the coin is already at the negative side and therefore a reflex bullish action is expected to correct the declines with a possible jump above $225. Meanwhile, if there is an increase in buying pressure, the price may break out of the channel to reach the $230 resistance. While trading at that level, a bullish continuation could reach the resistance levels of $240, $250, and $260 respectively.
On the other hand, a minimum swing below the moving averages may likely bring the market to a support level of $210. Exceeding this level could take the bears to $200, $190, and $180 levels.
When compares with Bitcoin, the bears are showing a greater commitment to the trading. According to the recent negative sign, the bearish trend may continue in as much as the buyers failed to push the price above the 9-day and 21-day moving averages.
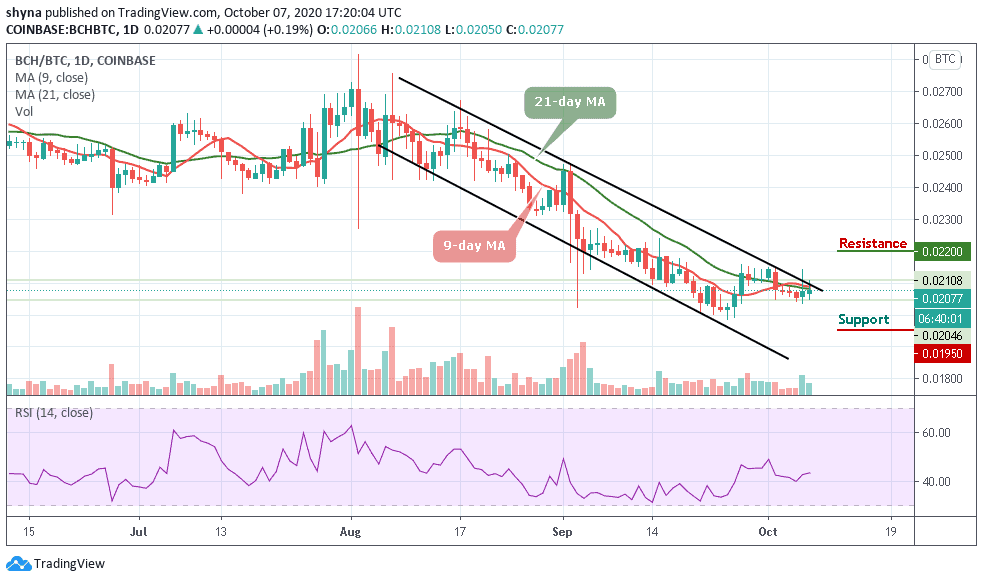
However, the RSI (14) is likely to cross the 45-level which may cause the coin to begin an upward trend. Any further bullish movement could push the coin to the resistance level of 0.022 BTC and above but a retest could lower the price to 0.0195 BTC and below.
Join Our Telegram channel to stay up to date on breaking news coverage