Join Our Telegram channel to stay up to date on breaking news coverage
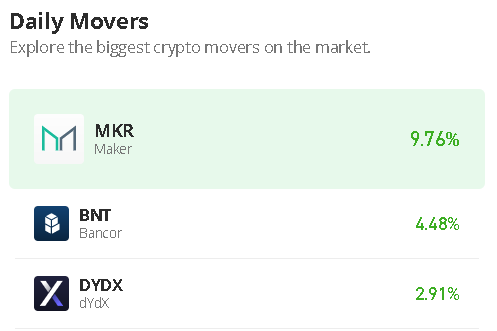
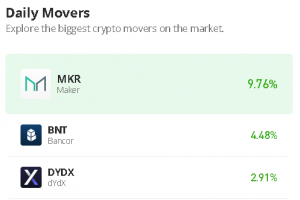
The Bancor price prediction reveals that BNT is moving bullishly with a gain of 5.84%, as the coin prepares to cross above the channel.
Bancor Prediction Statistics Data:
- Bancor price now – $0.457
- Bancor market cap – $86.5 billion
- Bancor circulating supply – 198.8 million
- Bancor total supply – 198.5 million
- Bancor Coinmarketcap ranking – #258
BNT/USD Market
Key Levels:
Resistance levels: $0.550, $0.600, $0.650
Support levels: $0.350, $0.300, $0.250
Your capital is at risk
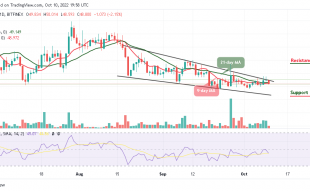
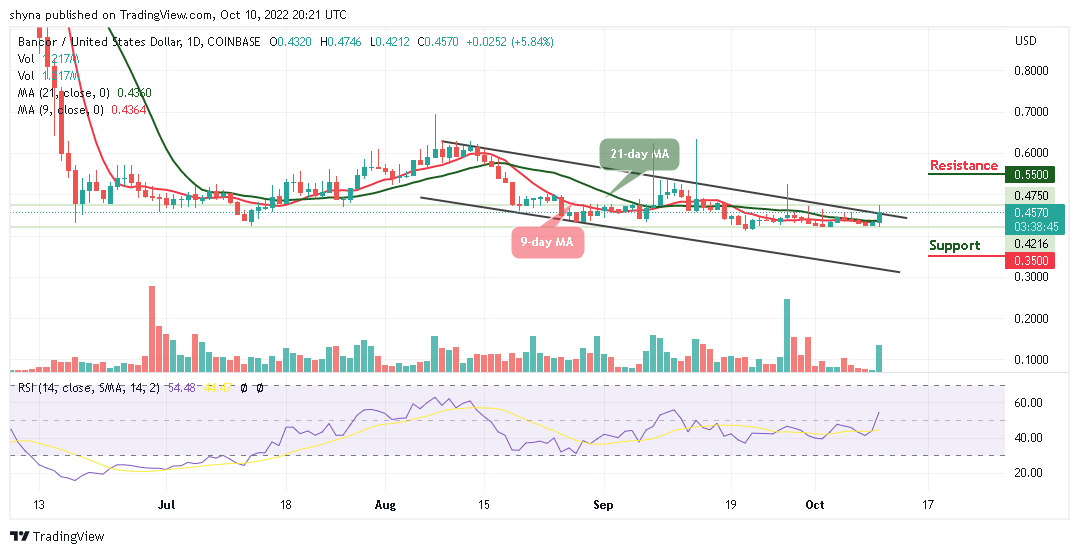
BNT/USD is seen trading in the green at the time of writing as the coin gets ready to cross above the upper boundary of the channel with a gain of 5.84%. According to the daily chart, the candle formation is currently following the upward movement but crossing below the 9-day and 21-day moving averages might position the market price towards the south and the closest support level is located around the $0.450 level.
Bancor Price Prediction: Bancor Price May Spike to the Upside
The Bancor price is currently above the 9-day and 21-day moving averages. Meanwhile, an increase above this barrier could trigger intense buying to the resistance levels of $0.550, $0.600, and $0.650 respectively. On the contrary, the Bancor price may likely hold a support level at $0.420 which could be the daily low. Therefore, if the Bancor price drops below this support level, it may likely hit the closest support at $0.400.
Meanwhile, the critical supports could be located around $0.350, $0.300, and $0.250 if the selling volume keeps increasing. More so, the technical indicator Relative Strength Index (14) reveals that the market may gain more upwards if the signal line keeps moving above the 50-level.
Against Bitcoin, the buyers are pushing the coin above the 9-day and 21-day moving averages. Meanwhile, from the upside, the nearest level of resistance lies above the upper boundary of the channel at 2600 SAT and above as the technical indicator Relative Strength Index (14) stays above the 50-level.
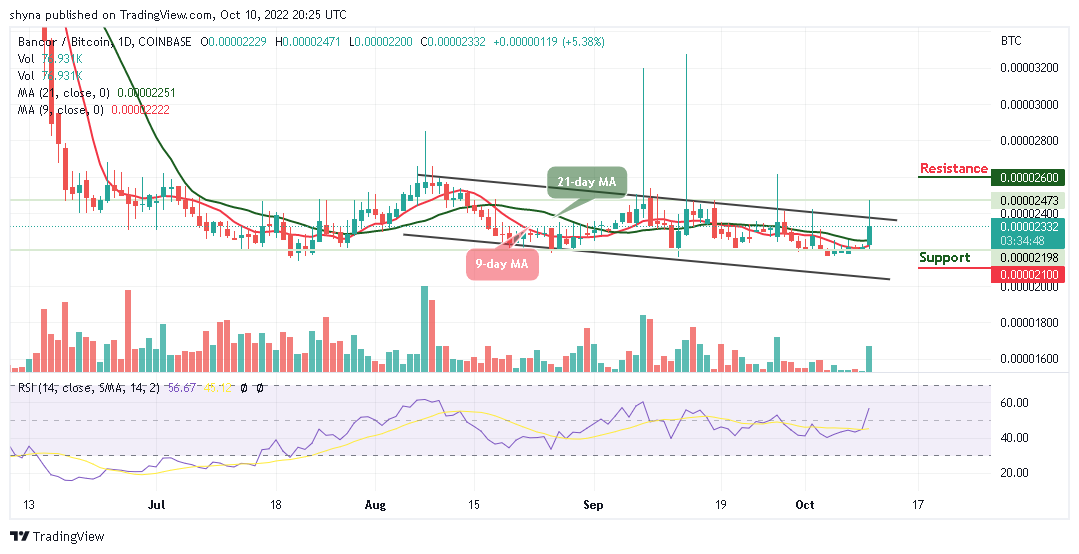
Looking at the downside; the nearest level of support is 2200 SAT, if the price drops further to create a new low, lower support could be found at 2100 SAT and below. In addition, if the 9-day MA crosses above the 21-day MA, this could be a confirmation that the market may follow the upward movement.
Join Our Telegram channel to stay up to date on breaking news coverage