Join Our Telegram channel to stay up to date on breaking news coverage
AUDUSD Price Analysis – June 10
In case the Bulls reject further decrease in price, then, the price may break up $0.701 level and target $0.711 level. Meanwhile, the Moving Average Convergence Divergence period 12 with its histogram is above zero level and the signal line pointing upside to connote buy signal.
AUD/USD Market
Key levels:
Supply levels: $0.701, $0.711, $0.722
Demand levels: $0.692, $0.680, $0.670
AUDUSD Long-term trend: Bearish
On the daily chart, AUDUSD is bearish. AUDUSD price was consolidating at the demand level of $0.692 last week. The Bulls prevailed over the Bears and the price increased towards the $0.701 price level. AUDUSD price reached the target of $0.701 as predicted last week. Today, the price experienced a pullback which is the normal phenomenon in a trending market. A daily strong bearish candle formed today that pushed the price back towards $0.692 level.
The bearish candle formed make AUDUSD price to continue its trade in between the 21 periods EMA and 50 periods EMA.
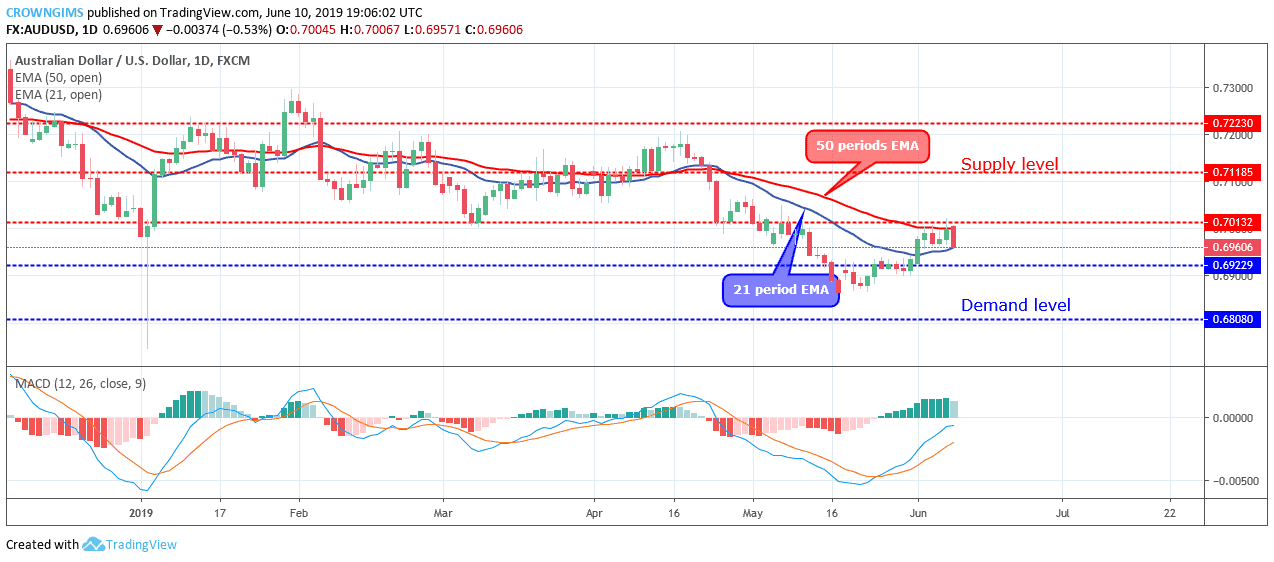
Further pressure from the Bears will lead to a further decrease in the price of the currency pair which may touch the previous low level at $0.692. In case the Bulls reject further decrease in price, then, the price may break up $0.701 level and target $0.711 level. Meanwhile, the Moving Average Convergence Divergence period 12 with its histogram is above zero level and the signal line pointing upside to connote buy signal.
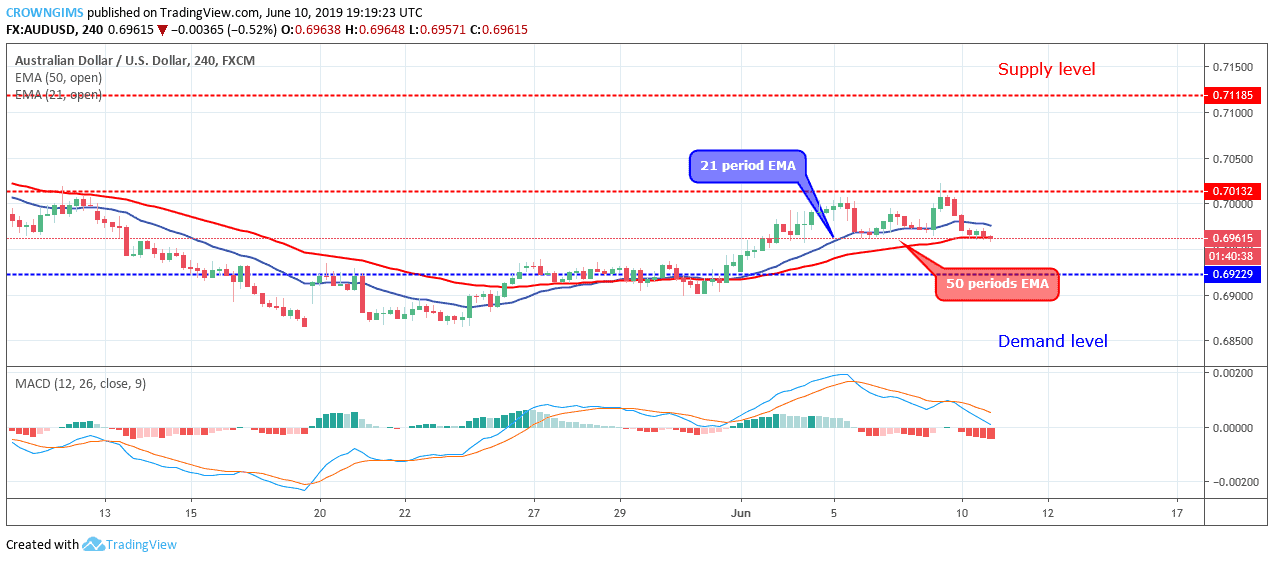
AUDUSD medium-term Trend: Ranging
AUDUSD is bullish in the medium-term outlook. The Bulls took over the AUDUSD market last week and the pair was propelled by the Bulls’ momentum towards $0.701 level but could not break up the level. The Bulls’ momentum became weak and the price started moving sideways near the supply level of $0.701. The currency pair is trading on and around the 21 periods EMA and 50 periods EMA as a sign of ranging movement in the AUDUSD market.

The MACD period 12 with its histogram is below zero levels and the signal lines pointing down to indicate sell signal.
Please note: insidebitcoins.com is not a financial advisor. Do your own research before investing your funds in any financial asset or presented product or event. We are not responsible for your investing results.
Join Our Telegram channel to stay up to date on breaking news coverage