


Join Our Telegram channel to stay up to date on breaking news coverage
AUDJPY Price Analysis – June 28
In case the Bulls were able to penetrate the $75 level with the formation of a bullish candle and the candle close above the level, then, AUDJPY price may reach the high of $77. Should the $75 level holds, the price will decrease to the previous low of $73 level.
AUD/JPY Market
Key levels:
Supply levels: $75, $77, $79
Demand levels: $73, $70. $$66
AUDJPY Long-term trend: Bearish
AUDJPY is bearish on the long-term outlook. The bearish condition continues as long as the price remains under the 50 periods EMA. The currency pair bottomed at $73 demand level on June 20. Bears lose their momentum and the AUDJPY price reverse with the formation of more bullish candles that pushed up the price towards $75 supply level
The AUDJPY price has broken up the 21 periods EMA and trying to penetrate 50 periods EMA in case the $75 level does not hold.
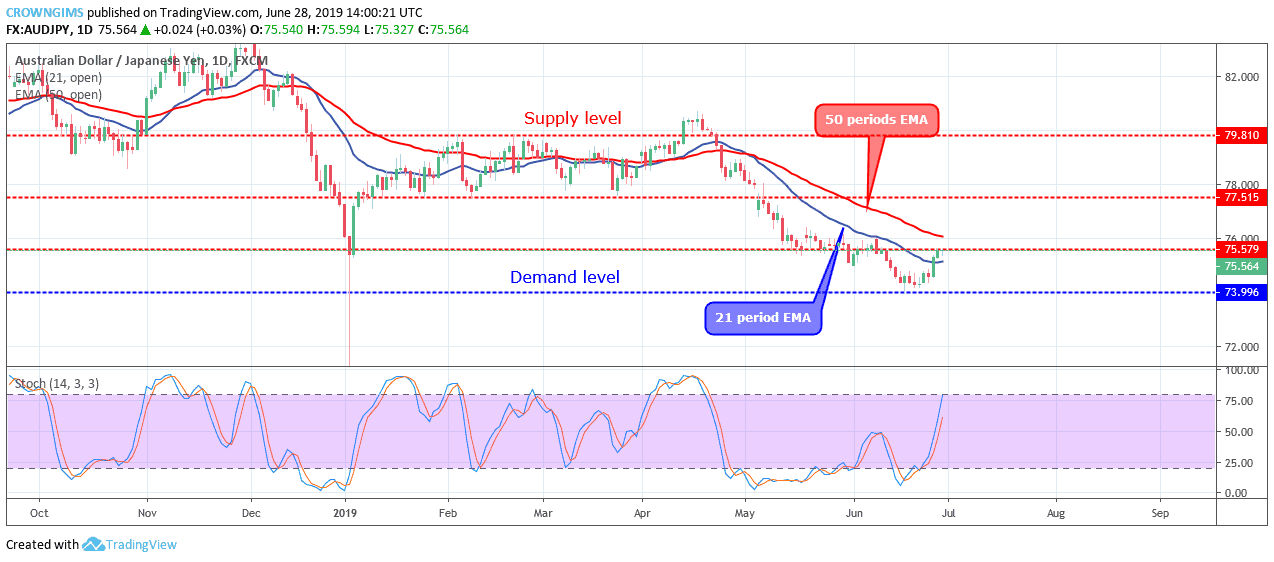
The bearish pressure is weak and the Bulls are gaining more pressure to break up the $75 price level. The stochastic Oscillator period 14 is above 50 levels and the signal lines pointing upside to indicate a buy signal. In case the Bulls were able to penetrate the $75 level with the formation of a bullish candle and the candle closes above the level, then, AUDJPY price may reach the high of $77. Should the $75 level holds, the price will decrease to the previous low of $73 level.
AUDJPY medium-term Trend: Bullish
AUDJPY is bullish on the medium-term outlook. On the 4-hour chart, the Bulls have taken over the market. The dynamic support and resistance have been broken up and the price has moved up to touch the $75 price level where the price is currently consolidating.
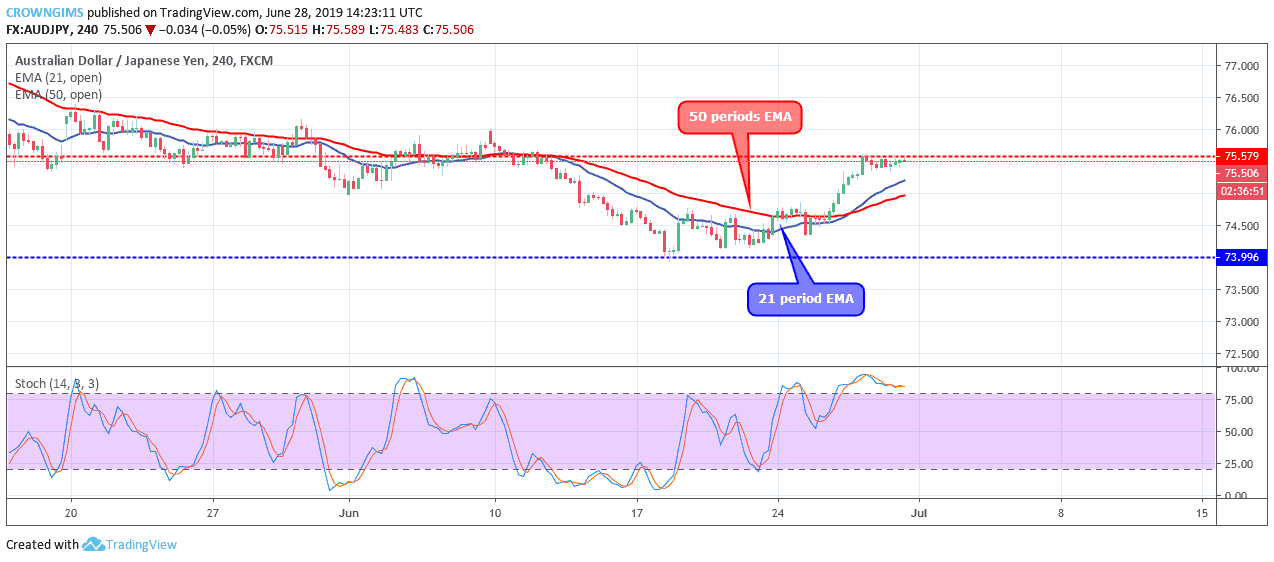
The price is trading above the 21 periods EMA and 50 periods EMAs which indicates buy signal.
Please note: insidebitcoins.com is not a financial advisor. Do your own research before investing your funds in any financial asset or presented product or event. We are not responsible for your investing results.
Join Our Telegram channel to stay up to date on breaking news coverage
