Join Our Telegram channel to stay up to date on breaking news coverage
Strong bearish movement in ATOM market
ATOMUSD Price Analysis – October 13
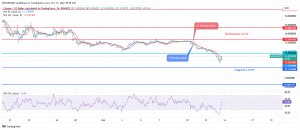
Should Cosmos penetrate the support level of $10 downside, ATOM may be exposed to the low of $8 and $7 support levels. In case bulls defend the support level of $10, Cosmos may increase to the resistance level at $11, further increase in the bulls’ pressure may push up the price to $13 and $14 levels.
ATOM/USD Market
Key levels:
Resistance levels: $11, $13, $14
Support levels: $10, $8, $7
ATOMUSD Long-term Trend: Bearish
ATOMUSD is bearish on the daily chart. An inverted head and shoulder chart pattern is noticed on the daily time frame. Atom was under the bulls’ control three weeks ago, the bullish power pushed the coin to the resistance level of $16. Another bearish chart pattern formed at the just mentioned level called Double Top. It is a signal to the traders that sellers are ready to dominate the market. The coin decreases and the support level of $10 is tested today.
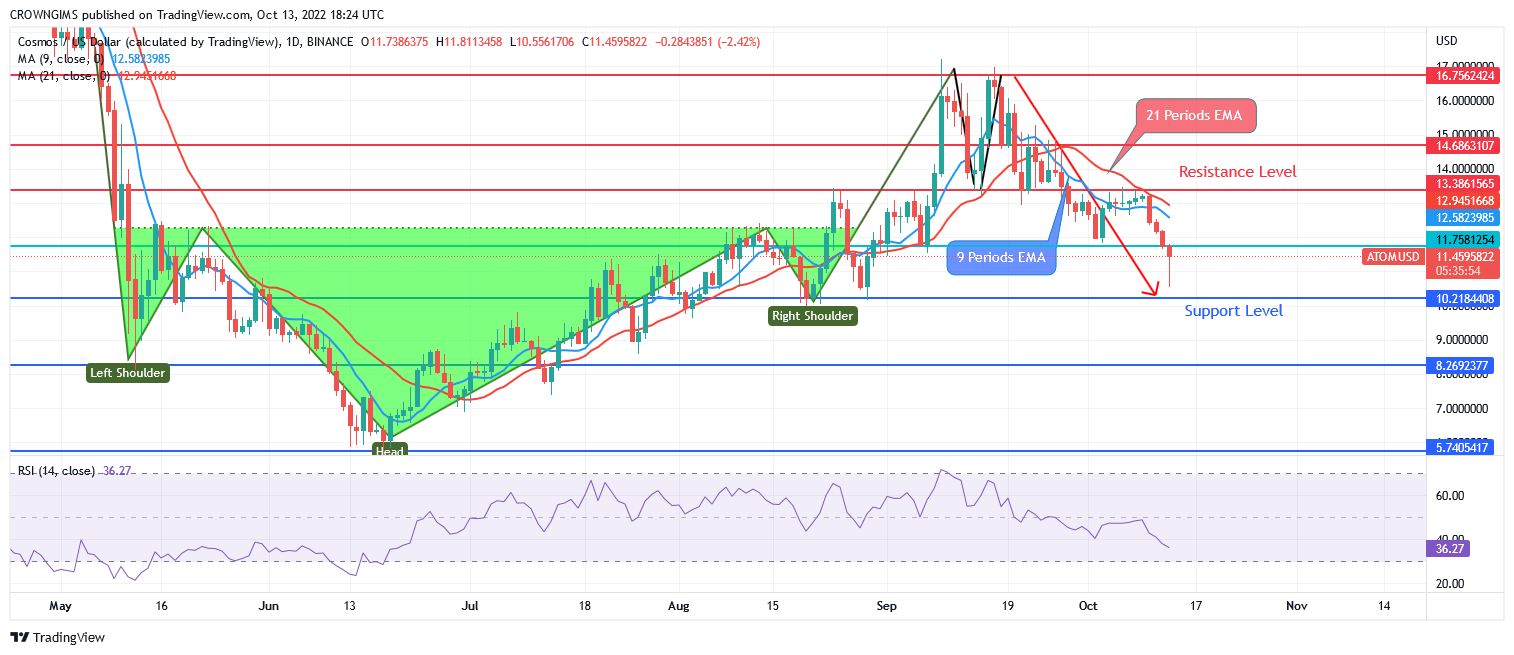
The price is trading below the two EMAs as a sign of bearish movement. The fast Moving Average (9 periods) is below the slow Moving Average (21 periods EMA) and are separated. Should Cosmos penetrate the support level of $10 downside, ATOM may be exposed to the low of $8 and $7 support levels. In case bulls defend the support level of $10, Cosmos may increase to the resistance level at $11, further increase in the bulls’ pressure may push up the price to $13 and $14 levels.
Your capital is at risk
ATOMUSD medium-term Trend: Bearish
ATOMUSD is bearish in the 4-hour chart. A Double Top chart pattern is concuspiously seen on the 4-hour Time Frame. It is formed at $16 resistance level. The bearish momentum increases and former support level of $13 and $11 is penetrated. Today, the support level of $10 is tested. It is currently pulling back.
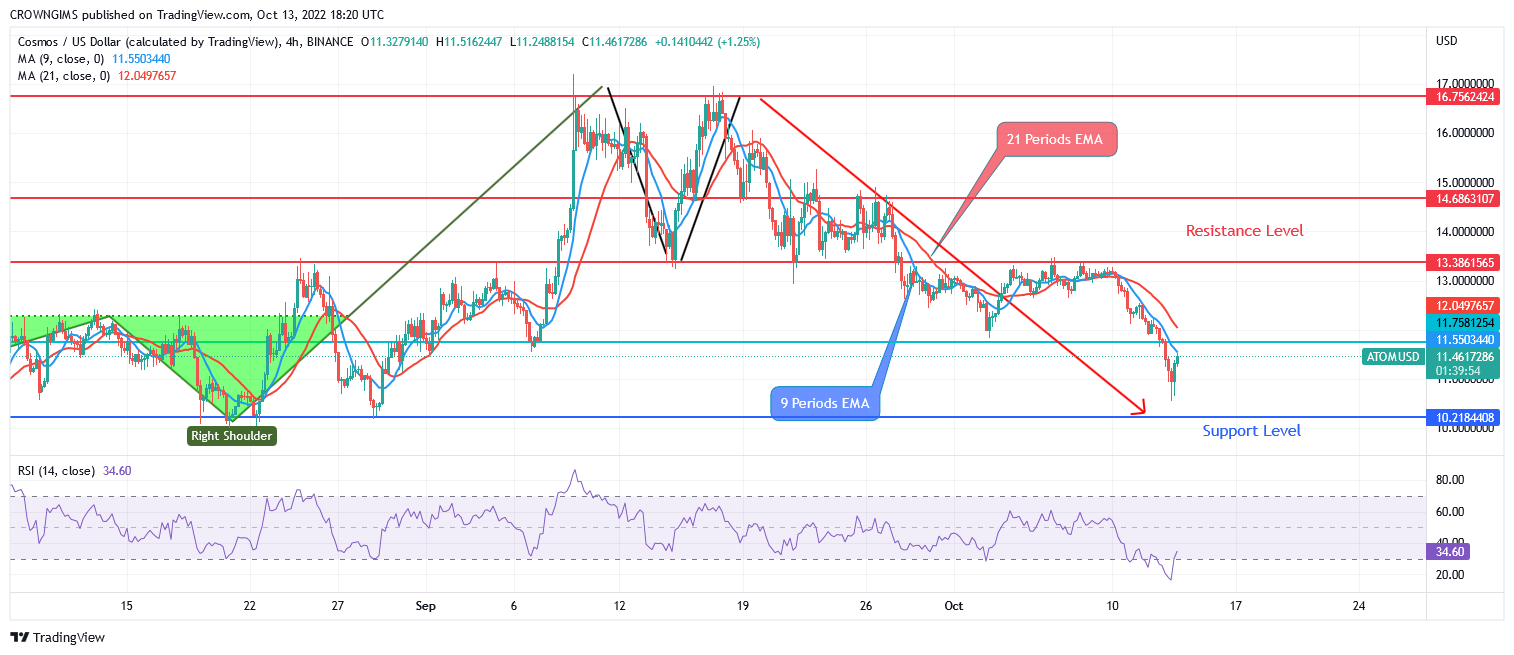
The two EMAs are separated from each other and the crypto is trading below the 21 periods EMA and 9 periods EMA which indicate a strong bearish momentum in ATOM market. The relative strength index period 14 is at 36 levels and the signal lines display bearish direction.
Join Our Telegram channel to stay up to date on breaking news coverage