Join Our Telegram channel to stay up to date on breaking news coverage
The struggle between demand and supply in the API3/USD market is reaching an epic proportion. This struggle has reduced the bullish momentum of the market as it strives to attain greater heights in price. The bullish trend started on the 19th of September, but along the line, it drags the bears with it to the upside, for they won’t let the bulls control the market.
API3 Market Price Statistic:
- API3/USD price now: $1.74500
- API3/USD market cap: $99,169,362
- API3/USD circulating supply: 56,547601
- API3/USD total supply: 114,855,860
- API3/USD coin market ranking: #188
Key Levels
- Resistance: $ 1.8000, $1.8500, $1.9000
- Support: $1.7000, $1.6500, $1.6000
Your capital is at risk
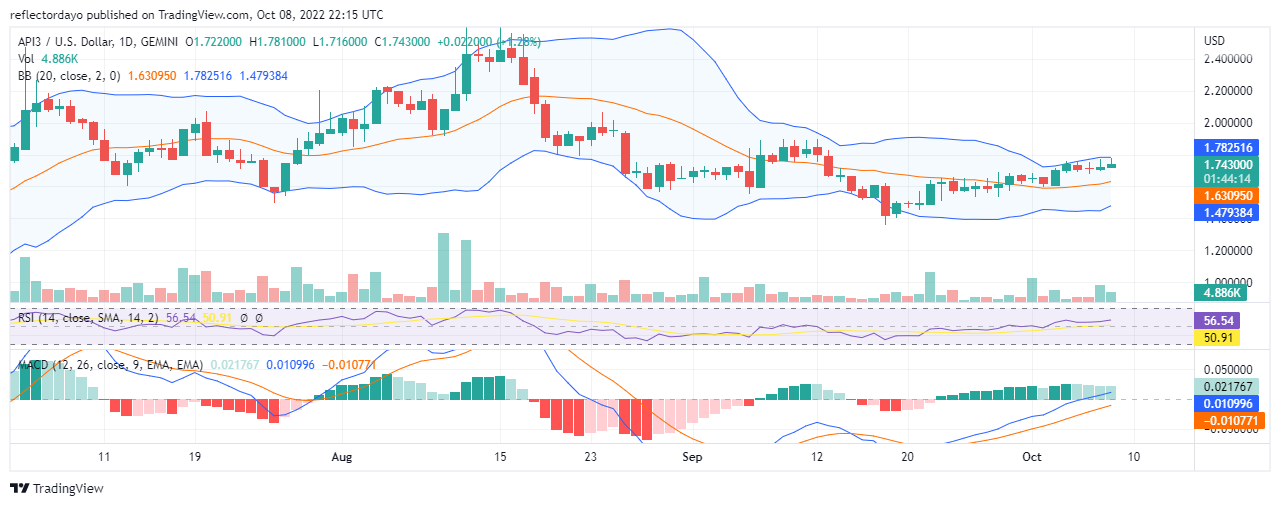
API3 Market Price Analysis: The Indicators’ Point of View
The high volatility in the market makes the upper and lower bands of the Bollinger indicator widen. There is growing interest to buy and sell API3. But as we can see from the chart, traders are buying the market more than they are selling the market. The RSI line is measuring 56% and there is still room for more bullish price action. Due to the high bullish momentum, the MACD line has crossed out into the bullish market zone of the indicator. The histograms are bullish, but because sellers are still very active, the histograms are now appearing in faded green. And the bullish momentum is reducing.
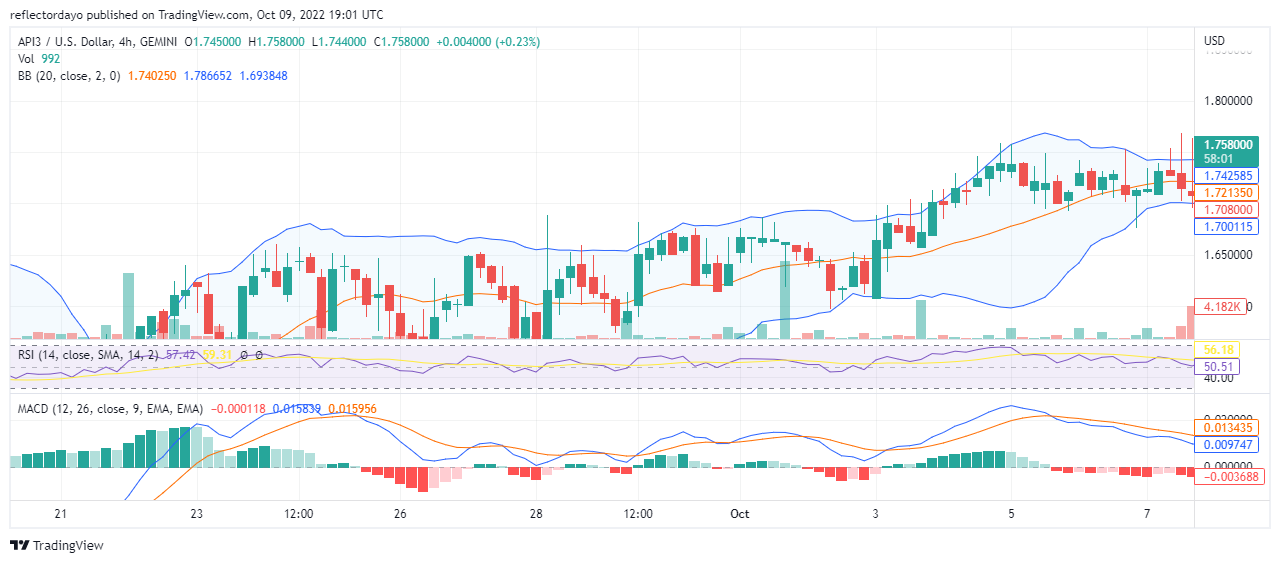
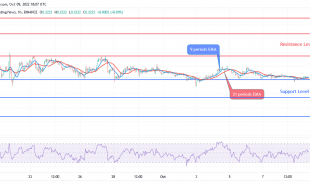
API3/USD 4-Hour Chart Outlook
In this timeframe, we can see what is responsible for the reduced momentum. The market entered the overbought in this timeframe and the price is retracing a lower price level.
On the 7th of October, the upper and lower bands of the Bollinger started to converge, despite the high volatility and the high amount of interest to trade the crypto. This was giving the signal that the market will soon break. And this happened to be a bullish breakout. The market now aims at the $1.8000 price level.
Join Our Telegram channel to stay up to date on breaking news coverage