Join Our Telegram channel to stay up to date on breaking news coverage
Bearish activities in the Apecoin market are responsive to the strong bullish move in the market. After the bullish market on the 19th of September, bearish pressure made the price of the market consolidate. And the bullish price is steadily recovering.
Apecoin Market Price Statistic:
- APE/USD price now: $5.324
- APE/USD market cap: $1,612,157,628
- APE /USD circulating supply: 306,875,000
- APE /USD total supply: 1,000,000,000
- APE /USD coin market ranking: #37
Key Levels
Resistance: $5.500, $5.700, $6.000
Support: $5.000, $4.667 $4.285
Your capital is at risk
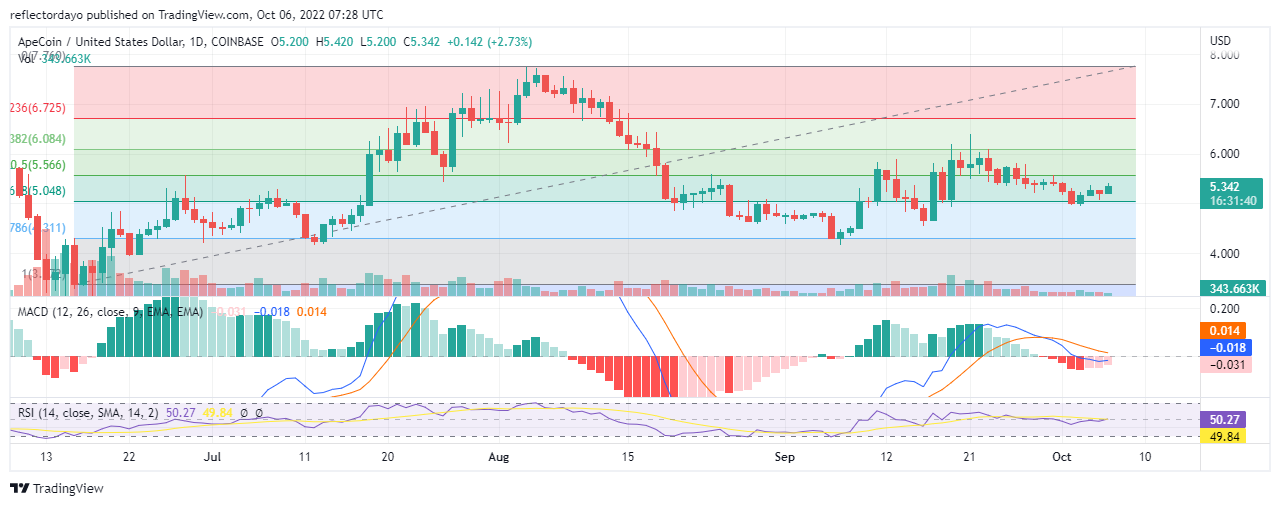
Apecoin Market Price Analysis: The Indicators’ Point of View
In the last three daily sessions, the negative histograms appear in pink; this shows that bulls are regaining ground in the market. The MACD line has just tested the negative zone of the indicator; it is trying to find direction to the upside as it responds to bullish activities in the market. The RSI line is now moving at the midpoint of the indicator as the market consolidates. After this ranging price period, it is expected that the market will decisively break out either to the upside or to the downside.
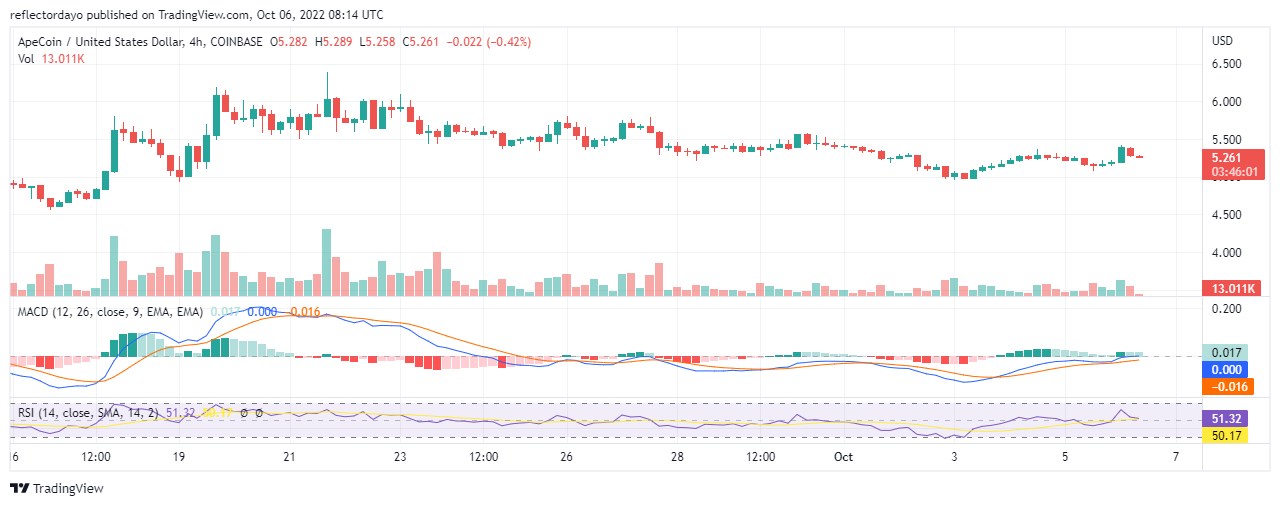
APE/USD 4-Hour Chart Outlook
Smaller time frames such as this one help in the prediction of the next direction of the price. The first session was very bullish. It was towards the end of the market that sellers begin to move the market in their favour and they recovered more than half of the grounds taken by the buyers. The MACD line and the RSI line are now moving on a horizontal pattern due to the market gridlock struggle between the bears and the bulls. The probability that the market will perform in favour of the bulls is high because according to the indicators the measurement of the line is in the bullish section.
Join Our Telegram channel to stay up to date on breaking news coverage