Join Our Telegram channel to stay up to date on breaking news coverage
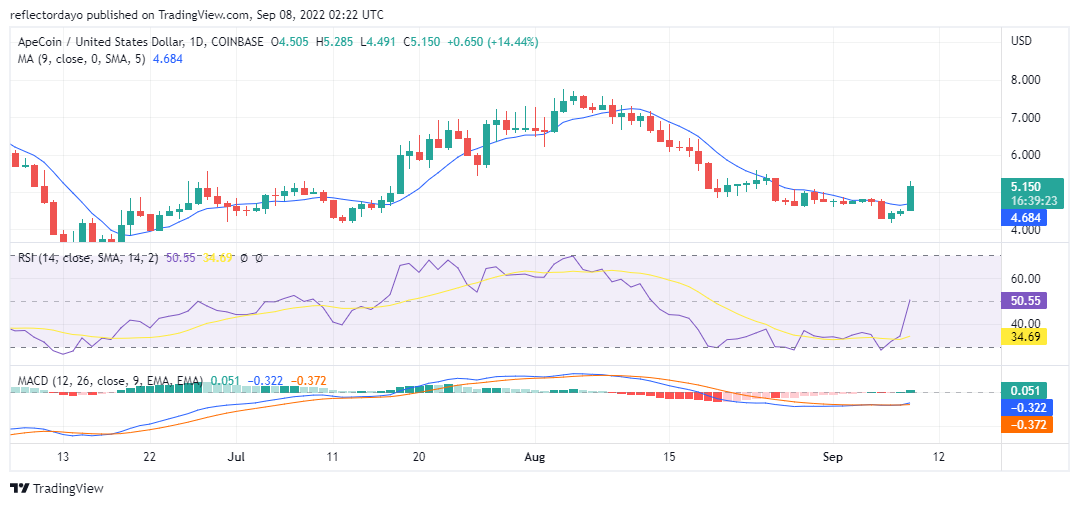
APE/USD has been trending downwards since August 9th after reaching the high price resistance level of $7.952. Since then, the price has been on its way to the downside. At some points, bulls tried to recover the price to the upper level, but they were too weak to do that. From the 20th to the 25th of August, bulls slightly raise the value of the market above the support level of $5.0000 and then, later on, the price falls below it. And since then til now, both bulls and bears became evenly matched in their struggle for control over the market. Neither of them could drive the price up or down. Bears became stronger on the 6th of September; they brought the price to the support level of $4.284. But In today’s market, the buyers are showing more strength and they have brought the price to around $5.228
ApeCoin Market Price Statistic:
- APE/USD price now: $5.228
- APE/USD market cap: $ 1,572,731,104
- APE/USD circulating supply: 306,875,000
- APE/USD total supply: 1,000,000,000
- APE/USD coin market ranking: #37
Key Levels
- Resistance: $5.500, $6.000, $6.500
- Support: $4.491, $4.000 $3.500
Your capital is at risk
ApeCoin Market Price Analysis: The Indicators’ Point of View
The RSI line crossed down into the lower zone of the indicator on the 13th of August and it had continued in the weak zone for this long period. Then between yesterday and today, the RSI line rises speedily to 51%. This is a sign of recovery of strength on the part of bulls. And in support of this, the MACD indications were on the negative side, but from the 2nd of September to the 8th of September, the two lines and the histograms point to a short period of price consolidation. Today, we can now see the MACD line diverging from the signal line of the indicator.
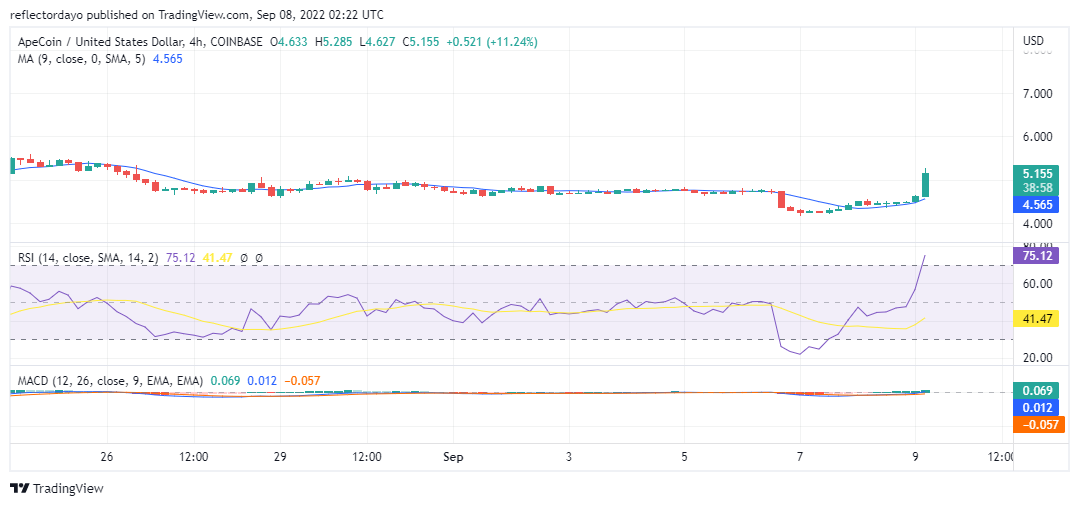
ApeCoin: BAL/USD 4-Hour Chart Outlook
The flat market came clearer in this timeframe. It may be an indication of weakness or reduction of interest between the two market players. However, at some point, both market players show sudden aggression at different times as they push the market in their favour on such occasions. As for today, bulls break the $5.000 price resistance level.
Related
Join Our Telegram channel to stay up to date on breaking news coverage