Join Our Telegram channel to stay up to date on breaking news coverage
For quite a while, bulls in the BTC/USD market have not had much of impressive market moves. An example of a such bullish market move that we expect was seen on July 26. That was when the price rose from around $21,000 to $23,000 in that daily trading session. Much of what has been seen, on the trading chart since then, were stronger bearish moves which had brought the price lower. Investors are selling their holdings rather than buying. On the 6th of September, the price dropped below the $19,000 support level. At this price level, it was rejected thereby forming another support slightly below $19,000. And that is where the price began its upward journey as it is currently at $20,672
Bitcoin Market Price Statistic:
- BTC/USD price now: $20,672
- BTC/USD market cap: $396,063,793,139
- BTC/USD circulating supply: 19,145,443.00
- BTC/USD total supply: 19,145,443
- BTC/USD coin market ranking: #1
Key Levels
- Resistance: $21,000, $21,500, $22,000
- Support: $19,000, $18,500 $18,000
Your capital is at risk
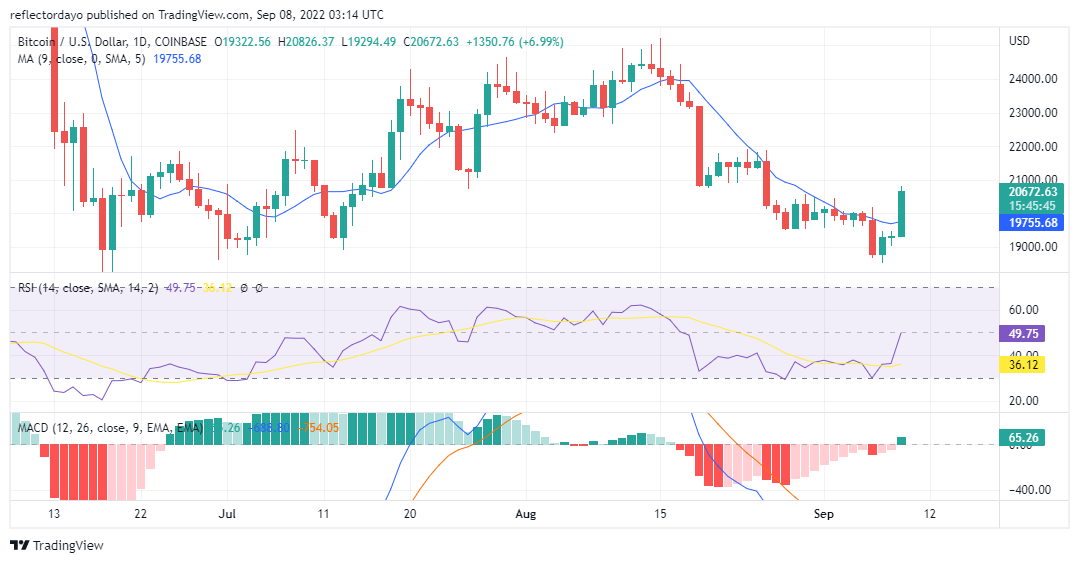
Bitcoin Market Price Analysis: The Indicators’ Point of View
The downtrend started on August 14th. The price kept in this direction up until today when bulls show some aggression in the market. However, at some point, in the downtrend, buyers tried hard to resist the downward pressure from sellers, but all the effort is to no avail. It only resulted in a brief sideways-ranging market. The MACD indicator has been pointing to a weakening selling pressure since the 29th of August. The negative histograms were in pink colours and the heights of the histograms were reduced as time goes on. The positive histogram, that suddenly popped up, which represents today’s trading activities shows very strong buying pressure. The Relative Strength Index is a bit slow to show that the selling pressure is weakening. The RSI is only able to show the sudden bullish price spike. This spike has taken the RSI line from the lower region to the threshold of the stronger market zone.
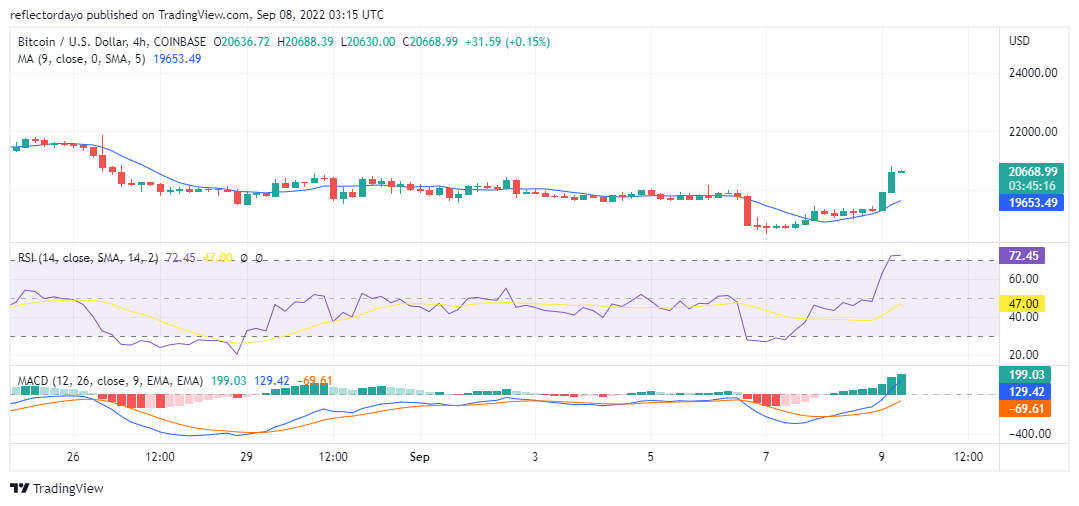
Bitcoin: BTC/USD 4-Hour Chart Outlook
On this outlook, we can see the progressive increase in price momentum from the histograms of the Moving Average Convergence and Divergence indicator. Both MACD lines are trying to retrace an upper level as they rise from the negative side of the indicator. The RSI line in this timeframe is not as rapid as the one on the daily chart. Conclusively, there is a high probability that the price of Bitcoin will rise further, judging from today’s bullish performance.
Related
- How to Buy Tamadoge
- Visit Tamadoge Website
Join Our Telegram channel to stay up to date on breaking news coverage