Join Our Telegram channel to stay up to date on breaking news coverage
The Ankr price prediction reveals that ANKR begins to form higher as the bears push the coin above the moving averages.
Ankr Price Statistics Data:
- Ankr price now – $0.019
- Ankr market cap – $194.95 million
- Ankr circulating supply – 10 billion
- Ankr total supply – 10 billion
- Ankr Coinmarketcap ranking – #131
ANKR/USD Market
Key Levels:
Resistance levels: $0.025, $0.027, $0.029
Support levels: $0.015, $0.013, $0.011

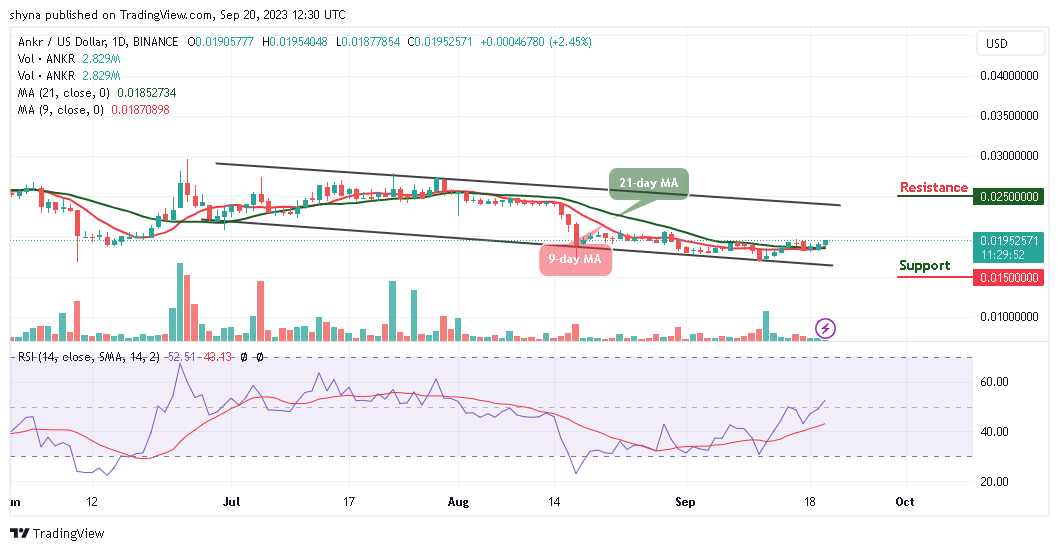
The Ankr price may head toward the upper boundary of the channel as the coin remains above the 9-day and 21-day moving averages. However, since the past few days, ANKR/USD has been following bullish movement and this could make the coin touch the nearest resistance level of $0.025.
Ankr Price Prediction: Will Ankr Continue to Move Higher?
The Ankr price is ready to create move additional bullish movement as the coin continues to rise and could probably cross above the upper boundary of the channel if the bulls hit the $0.023 resistance level. Therefore, any further bullish movement above this barrier may push the price to the potential resistance levels of $0.025, $0.027, and $0.029.
Nevertheless, this technical prediction may be invalidated if the bears break below the 9-day and 21-day moving averages as any bearish movement may reach the support levels of $0.022, $0.020, and $0.018. Moreover, the technical indicator Relative Strength Index (14) is hovering above the 50-level to keep the coin on the upside.
ANKR/BTC May Follow Bullish Movement
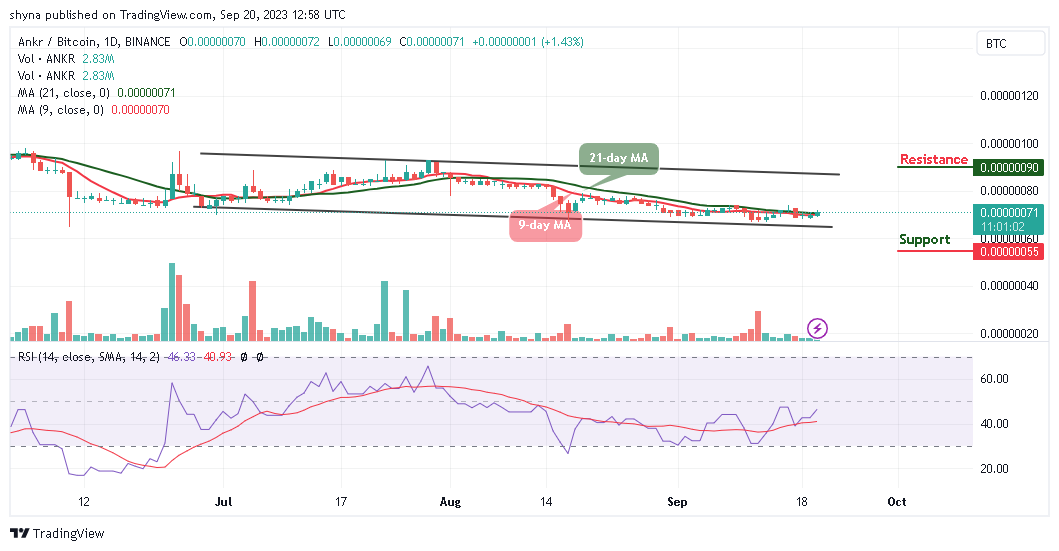
Against Bitcoin, the Ankr price is exchanging hands within the 9-day and 21-day moving averages with a major resistance level of 71 SAT. The long-term moving averages may likely keep the bullish movement as the market is starting a new trend by moving near the upper boundary of the channel.

However, if the buyers could push the price above this barrier, a higher resistance level could be located at 90 SAT and above. Meanwhile, the technical indicator Relative Strength Index (14) could move above the 50-level, suggesting more bullish signals. Moreover, should the bulls fail to move the current market value to the north, the bears may step back into the market, and the nearest support level could be located at 55 SAT and below.
Alternatives to Ankr
According to the daily chart, the Ankr price is hovering around $0.019 with a slight bullish movement toward the upper boundary of the channel. However, if the bulls put more pressure, the resistance level of $0.020 could be reached. Moreover, the technical indicator Relative Strength Index (14) is crossing above the 60-level to increase the bullish movement.
Moreover, the Wall Street Memes token happens to be one of the most successful tokens of the year. Meanwhile, by leveraging a massive community behind it, the $WSM token is speeding through a highly successful presale as over $25 million has been raised in the presale. Investors are to act promptly to acquire some token at the current price before experiencing a significant surge.
New OKX Listing - Wall Street Memes
- Established Community of Stocks & Crypto Traders
- Featured on Cointelegraph, CoinMarketCap, Yahoo Finance
- Rated Best Crypto to Buy Now In Meme Coin Sector
- Team Behind OpenSea NFT Collection - Wall St Bulls
- Tweets Replied to by Elon Musk
Join Our Telegram channel to stay up to date on breaking news coverage


