Join Our Telegram channel to stay up to date on breaking news coverage
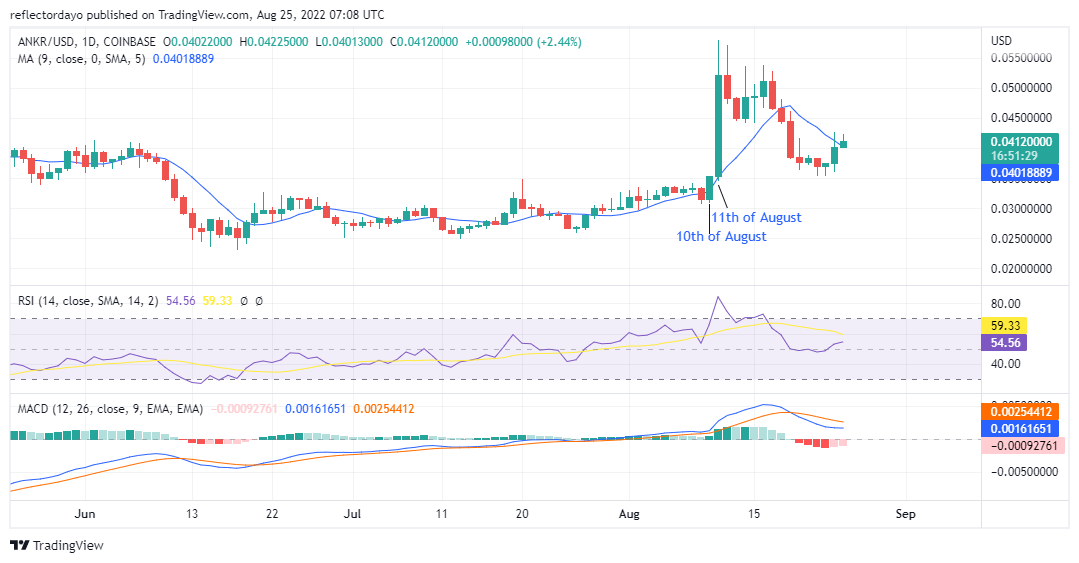
After almost two months of market indecision, bulls change the game. The change in the ranging market ended on 11th August, after a spike in the buying pressure that made ANKR/USD gain by 48%. From then on, the market trend starts to be erratic. From that height of the $0.5214392 resistance level, the price swings low to the $0.03683826 support level within 11 days. The buying pressure appears to significantly affect the selling pressure.
Ankr Price Statistic:
- ANKR price now: $0.04103
- ANKR market cap: $398,735,614
- ANKR circulating supply: 9.66 Billion
- ANKR total supply: 10,000,000,000
- ANKR coin market ranking: #92
Key Levels
- Resistance: $0.04099741, $0.04465746, $0.04648748
- Support: $0.04449109, $0.03850192 $0.03700463
Your capital is at risk
Ankr Price Analysis: The Indicators Point of View
According to the Moving Average Convergence and Divergence indicator, the histograms, though bullish, are very small. Their activities are so flat that they almost blend with point zero. The two lines of the indicator (fast and slow line) were performing very close to each other until the 11th of August when the game changed in the market. It can be observed that the market is repeating the same pattern of movement. This market swing can even be observed after the price action skyrockets, then it swings low. However, if we look closely, the bearish swing is not as powerful as the bullish swing. The bearish swing did not go beyond the bullish support level of $0.03151455 on the 10th of August. The RSI line is responding fast to today’s bullish market. The RSI line will soon cross the signal line. When this happens we can be sure that trend is now in favour of the bulls again.
Ankr Price Analysis: OGN/USD 4-Hour Chart Outlook
On the 4-hour chart, the price still appears to be ranging sideways. But between yesterday and today, the bulls dominate the market. However, those bullish candlesticks were not very strong. the selling pressure makes the bullish candle close the session near its opening price. that is a sign of weakening buying pressure. Selling pressure in the market is also strong, but not as strong as the buying pressure. Because of this, the price may not appreciate too much today.
Related
Join Our Telegram channel to stay up to date on breaking news coverage