


Join Our Telegram channel to stay up to date on breaking news coverage
ADAUSD Price Analysis – August 10
The breakout is imminent; which could be at the support level of $0.043 and the coin will be exposed to the support level of $0.026 or the breakout at the resistance level of $0.058 to open up to $0.068 price level.
ADAUSD Market
Key Levels:
Resistance levels: $0.058, $0.068, $0.083
Support levels: $0.043, $0.026, $0.01
ADA/USD Long-term Trend: Bearish
On the Long-term outlook, ADA/USD is bearish. ADAUSD has been under the control of the Bears. The bearish momentum drove the price down with full pressure, broke down the barriers at $0.068, $0.058 and the price decreased towards the demand level of $0.043. The Bulls did not allow a further decrease in Cardano price. The price was pushed up to retest the $0.068. The price commenced sideways movement down to the previous low level at $0.043.
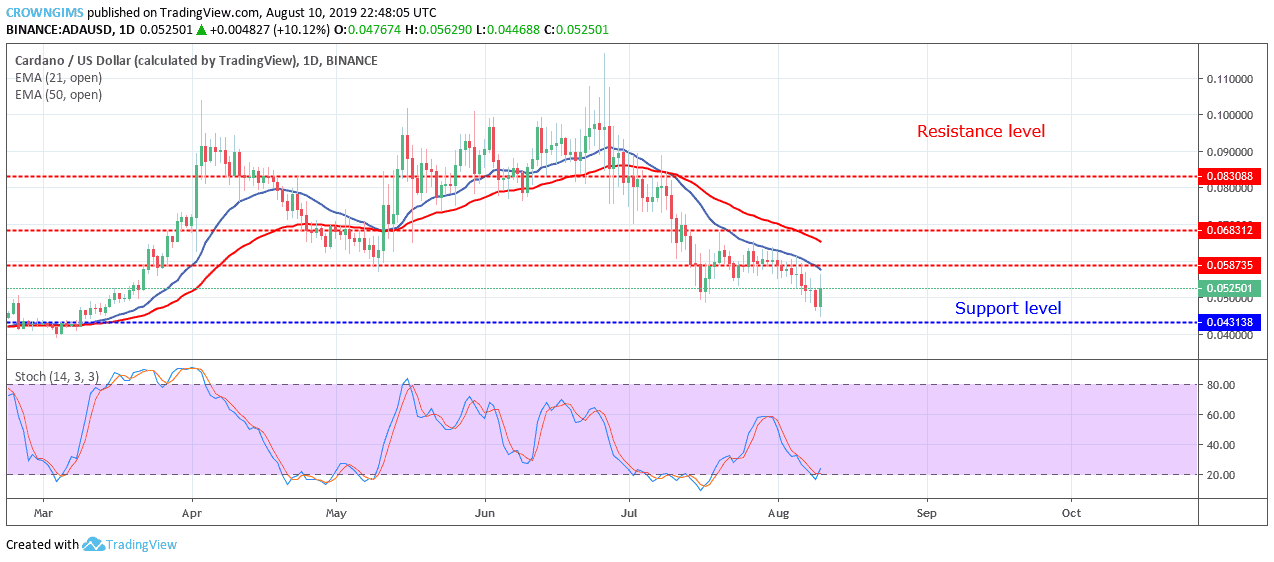
The breakout is imminent; which could be at the support level of $0.043 and the coin will be exposed to the support level of $0.026 or the breakout at the resistance level of $0.058 to open up to $0.068 price level. The trading continues below the 21 periods EMA and 50 periods EMA as a sign of bearish momentum in the market of ADA. Meanwhile, the stochastic oscillator period 14 is at 20 levels with the signal line bending down to indicate sell signal.
ADA/USD Medium-term Trend: Bearish
On the Medium-term outlook, ADA is bearish. After a long period of consolidation at the supply level of $0.058,, the price dropped to the demand level of $0.046. A bullish engulfing candle emerged and the price bounced up to break up the two EMA and rally towards the supply level of $0.058. The coin is currently at the dynamic resistance level of 50 periods EMA.
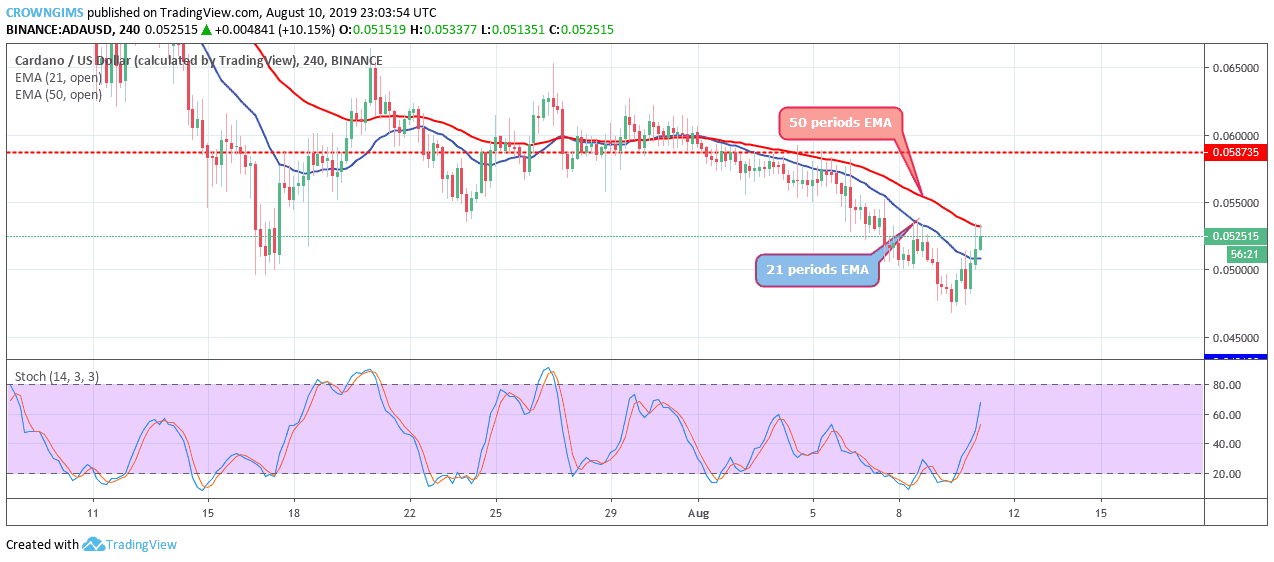
The ADA price is trading in between the 21 periods EMA and 50 periods EMA as a bullish momentum indicator in the ADA market. Also, the stochastic oscillator period 14 is at 60 levels with the signal lines pointing up which indicate buy signal.
Please note: insidebitcoins.com is not a financial advisor. Do your own research before investing your funds in any financial asset or presented product or event. We are not responsible for your investing results
Join Our Telegram channel to stay up to date on breaking news coverage