Join Our Telegram channel to stay up to date on breaking news coverage
EOSUSD Price Analysis – August 10
Increase in Bears’ momentum may break down the support level of $3.7 and the EOS may find its low at $3.0 support level. In case the support level of $3.7 holds, ranging movement may continue within the range.
EOSUSD Market
Key Levels:
Resistance levels: $4.4, $5.1, $5.9
Support levels: $3.7, $3.0, $2.1
EOS/USD Medium-term Trend: Ranging
EOS/USD is on the sideways movement on the medium-term outlook. The cryptocurrency is range-bound within the resistance level of $4.4 and the support level of $3.7. The sideways movement started on July 17 shortly after the Bulls prevented further decrease in price at the demand level of $3.7. The price pulled back to retest the broken level of $4.4. The momentum of both the Bulls and the Bears became weak and this resulted in ranging.
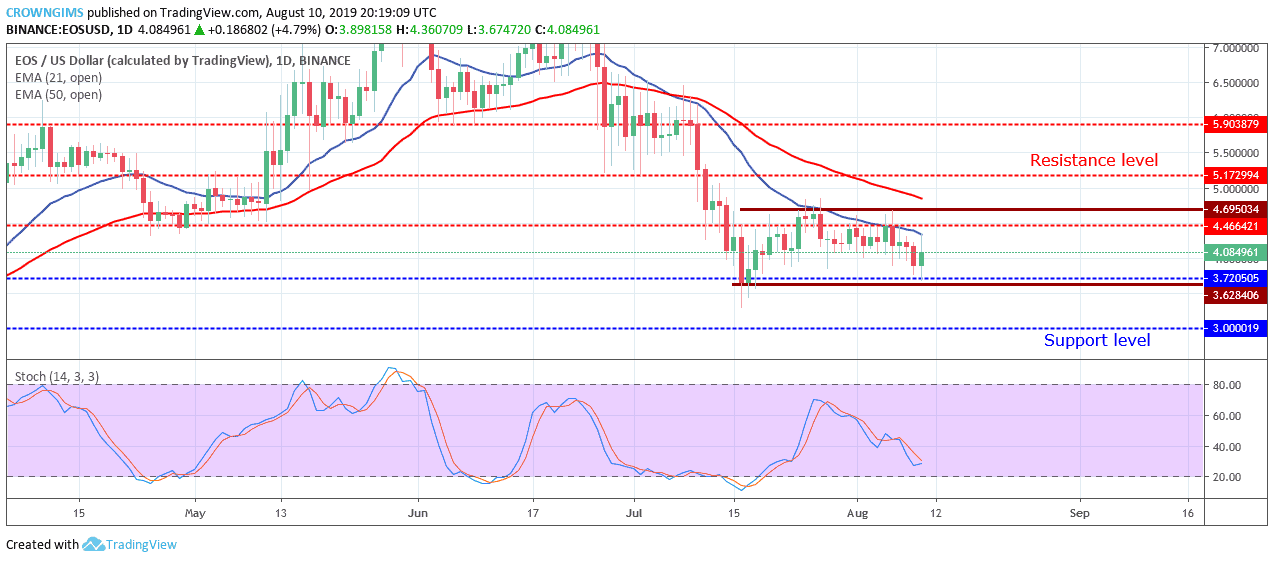
The two EMAs are well separated from each other and the EOS is trading below the 21-day EMA and the 50-day EMA which indicate that the Bears are still in control of the EOS market. The Stochastic Oscillator period 14 is above 20 levels with the signal lines showing no direction to indicate ranging market. Increase in Bears’ momentum may break down the support level of $3.7 and the EOS may find its low at $3.0 support level. In case the support level of $3.7 holds ranging movement may continue within the range.
EOS/USD Short-term Trend: Ranging
EOS is on the sideways movement on the short-term outlook. The Bulls’ momentum and the Bears momentum seems to be at equilibrium on the 4-hour chart. The price is moving in a sideways mode within the $4.4 and $3.7 price level. The coin experienced a fake breakout at the resistance level of $4.4 on July 24 before it was returned into the range level by the Bears.
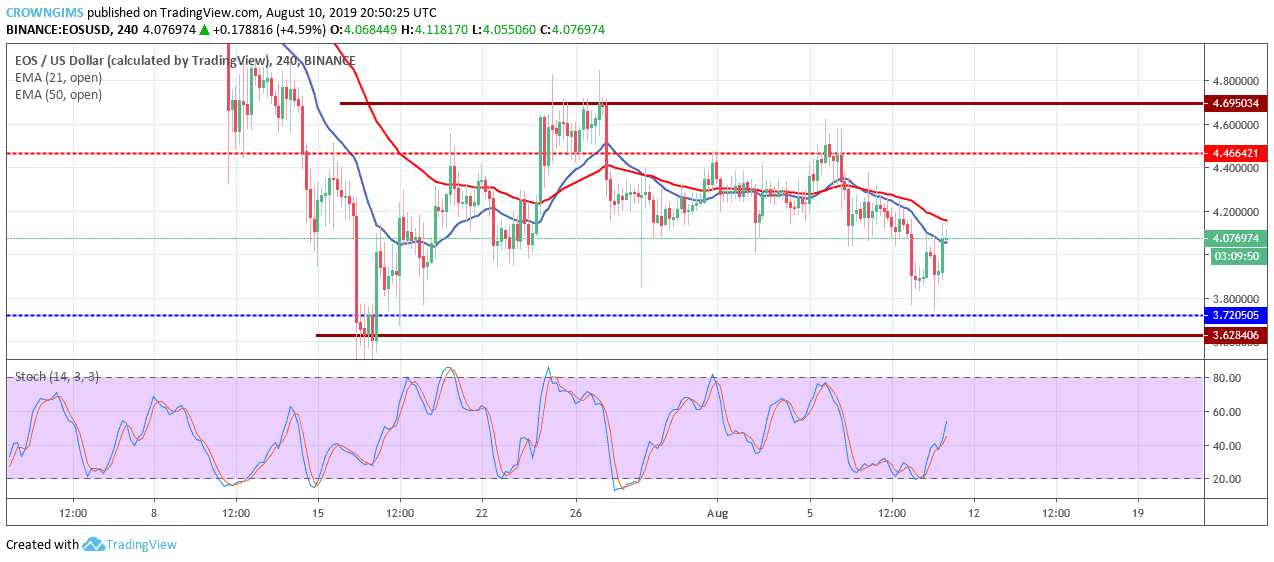
The two EMAs are interlocked with each other and the price is hovering over and around the 21 periods EMA and 50 periods EMA to indicate that sideways movement are ongoing in the EOS market. However, the stochastic oscillator period 14 is above 40 levels with the signal lines pointing up which connotes sell signal.
Please note: insidebitcoins.com is not a financial advisor. Do your own research before investing your funds in any financial asset or presented product or event. We are not responsible for your investing results
Join Our Telegram channel to stay up to date on breaking news coverage