Join Our Telegram channel to stay up to date on breaking news coverage
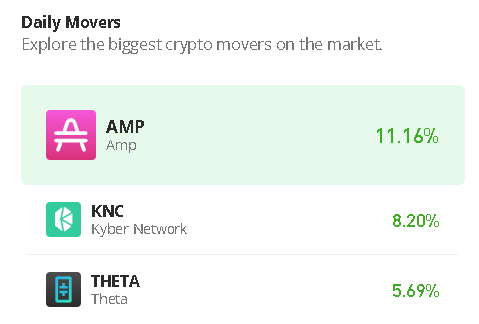
The Amp price prediction shows that AMP escalates, but a break above $0.0029 may pull the coin toward $0.0030 in the coming trading sessions.
Amp Prediction Statistics Data:
- Amp price now – $0.0026
- Amp market cap – $103.9 billion
- Amp circulating supply – 42.2 billion
- Amp total supply – 99.21 billion
- Amp Coinmarketcap ranking – #189
AMP/USD Market
Key Levels:
Resistance levels: $0.0033, $0.0035, $0.0037
Support levels: $0.0017, $0.0015, $0.0013
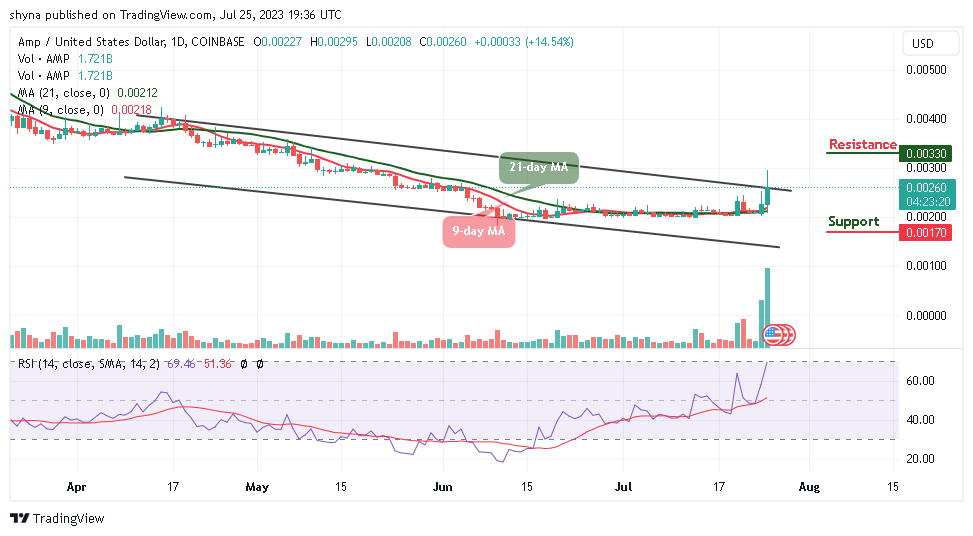
AMP/USD is currently trading around the resistance level of $0.0026 after touching the daily high of $0.0029 in the early hours of today. However, this could easily pave the way for gains above the upper boundary of the channel. Therefore, if the technical indicator Relative Strength Index (14) moves into the overbought region, the market may show that the bullish grip may be getting stronger.
Amp Price Prediction: Amp (AMP) May be Ready to go Higher
The Amp price is currently holding the ground above the 9-day and 21-day moving averages after a major recovery from $0.0020. This shows that buyers may begin to have the upper hand in the price movement, and they could easily push the coin toward the potential resistance of $0.0033, $0.0035, and $0.0037. In other words, if the buying action fails to break above $0.0030, then AMP/USD could instead settle for consolidation.
However, it is about time that buyers increase their confidence in the recovery because $0.0030 is still achievable. Therefore, if the bears push the coin below the moving averages, the support levels of $0.0017, $0.0015, and $0.0013 may be reached.
Against Bitcoin, the Amp price remains below the 50-level as the 9-day MA keeps hovering above the 21-day MA. Meanwhile, if the market price eventually crosses above moving averages, traders might expect a long-term bullish movement.
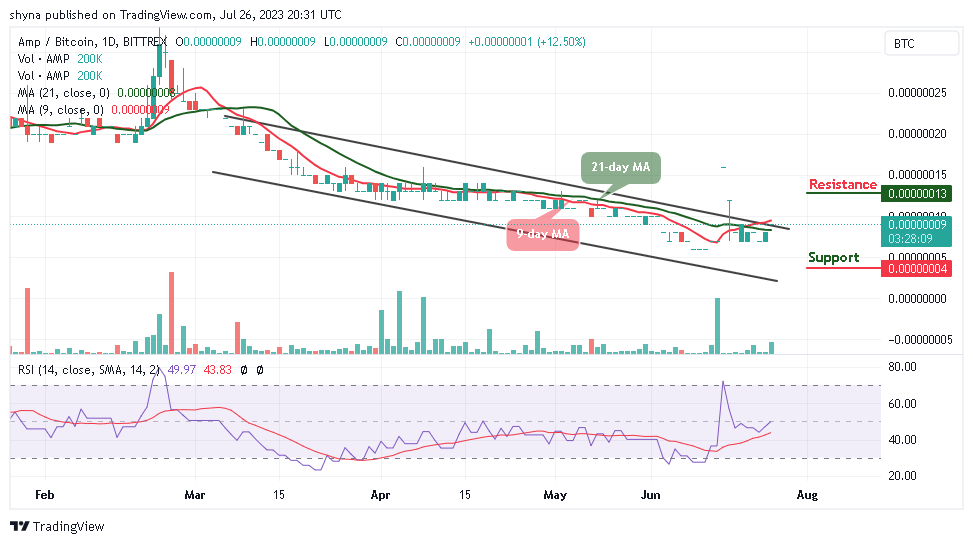
Meanwhile, any bearish movement toward the lower boundary of the channel may likely meet the major support at 7 SAT before falling to 4 SAT and below while the buyers may need to push the market to the potential resistance at 13 SAT and above as the technical indicator Relative Strength Index (14) moves to cross above the 40-level to give bullish signals.
Alternatives to Amp
The daily chart shows that the Amp price may likely create more bullish trends once the sideways movement fades away, and this is noticeable for the technical indicator Relative Strength Index (14) as the signal line moves to cross into the overbought region.
Meanwhile, as the crypto community continues to ride the wave of meme coins, a new contender is turning heads which is Wall Street Memes ($WSM). During a massively successful presale that has now raised close to $18m, Wall Street Memes ($WSM) has positioned itself as a token with the potential to erupt.
New OKX Listing - Wall Street Memes

- Established Community of Stocks & Crypto Traders
- Featured on Cointelegraph, CoinMarketCap, Yahoo Finance
- Rated Best Crypto to Buy Now In Meme Coin Sector
- Team Behind OpenSea NFT Collection - Wall St Bulls
- Tweets Replied to by Elon Musk
Join Our Telegram channel to stay up to date on breaking news coverage