

Join Our Telegram channel to stay up to date on breaking news coverage
The Amp price prediction shows that AMP could set a bullish run if the market can keep the coin above the resistance level of $0.0032.
Amp Prediction Statistics Data:
- Amp price now – $0.0032
- Amp market cap – $140.9 billion
- Amp circulating supply – 42.2 billion
- Amp total supply – 99.21 billion
- Amp Coinmarketcap ranking – #184
AMP/USD Market
Key Levels:
Resistance levels: $0.0045, $0.0047, $0.0049
Support levels: $0.0020, $0.0018, $0.0016
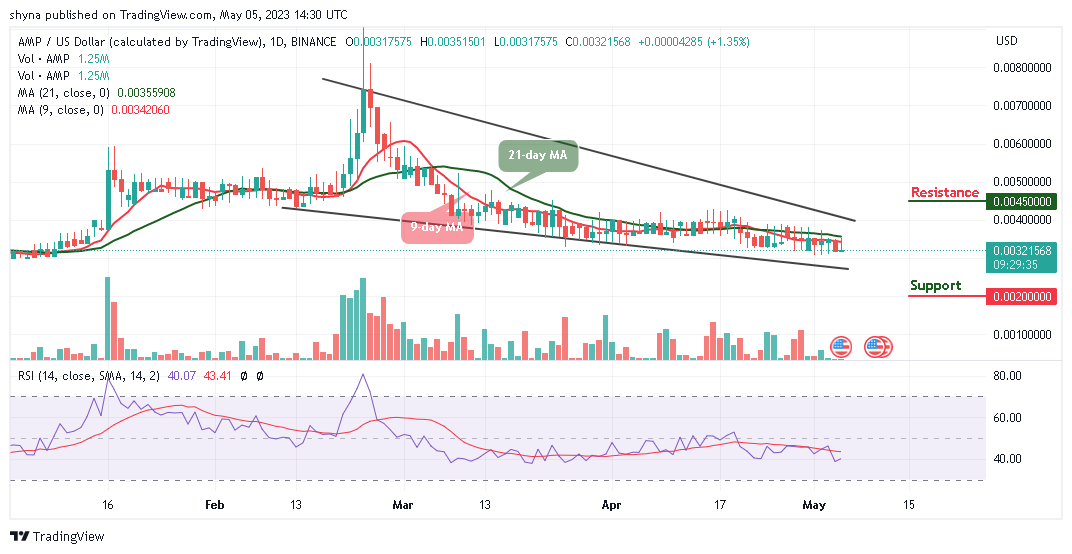
AMP/USD is running a little retracement move above $0.0031 with price growth of 1.35%. For the fact that the coin is recording some gain, the Amp price may begin to follow a bullish movement if it crosses above the 21-day moving average. Meanwhile, traders can expect the price to continue to rise if the bulls put more pressure on the market.
Amp Price Prediction: AMP/USD May Move Upside
The Amp price is on its way above the 21-day moving average at around $0.0032. If the price continues to create a bullish movement, traders can then expect a bullish continuation toward the upside. Meanwhile, as the technical indicator Relative Strength Index (14) moves to cross above the 40-level, the possible resistance levels could be found at $0.0045, $0.0047, and $0.0049 in the long term.
However, if the coin keeps the bullish movement for the next couple of days, traders may witness more of it reach higher levels. Nevertheless, the Amp price is trying to create a bullish movement in the short term. On the contrary, any bearish movement below the lower boundary of the channel could roll the coin back to the long-term support at $0.0020, $0.0018, and $0.0016 levels.
Against Bitcoin, the Amp price may head toward the upper boundary of the channel if buyers push the coin above the 9-day and 21-day moving averages. With the look of things, there is a need for an increasing volume and resistance to cause an upsurge in the market. At the moment, Amp (AMP) is trading around the 12 SAT and traders can expect close support at 6 SAT and below.
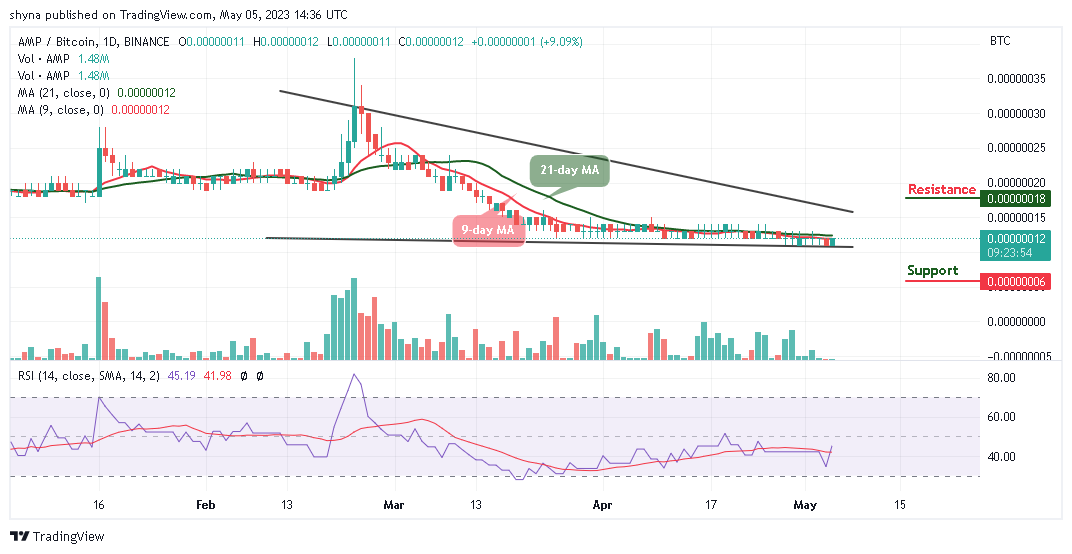
However, if a bullish move pushes the price toward the upper boundary of the channel; traders can then confirm a bull run for the coin. Moreover, the closest resistance could be located at 18 SAT and above as the technical indicator Relative Strength Index (14) moves above the 40-level, suggesting bullish movement.
Amp Alternatives
The Amp price may need to undergo a much-needed break to the positive side by pushing the price toward the upper boundary of the channel if the bulls can push the coin above the 9-day and 21-day moving averages. Meanwhile, any bearish movement below the daily low could lead the coin to serious downtrends. Meanwhile, another new meme coin is exploding right along with it. It’s called Love Hate Inu (LHINU), and it’s a Vote-to-Earn crypto that’s primed to completely disrupt the online survey industry. However, the token has raised almost $11 million in the ongoing presale.
Join Our Telegram channel to stay up to date on breaking news coverage