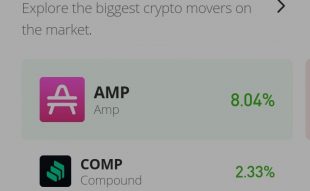
Join Our Telegram channel to stay up to date on breaking news coverage
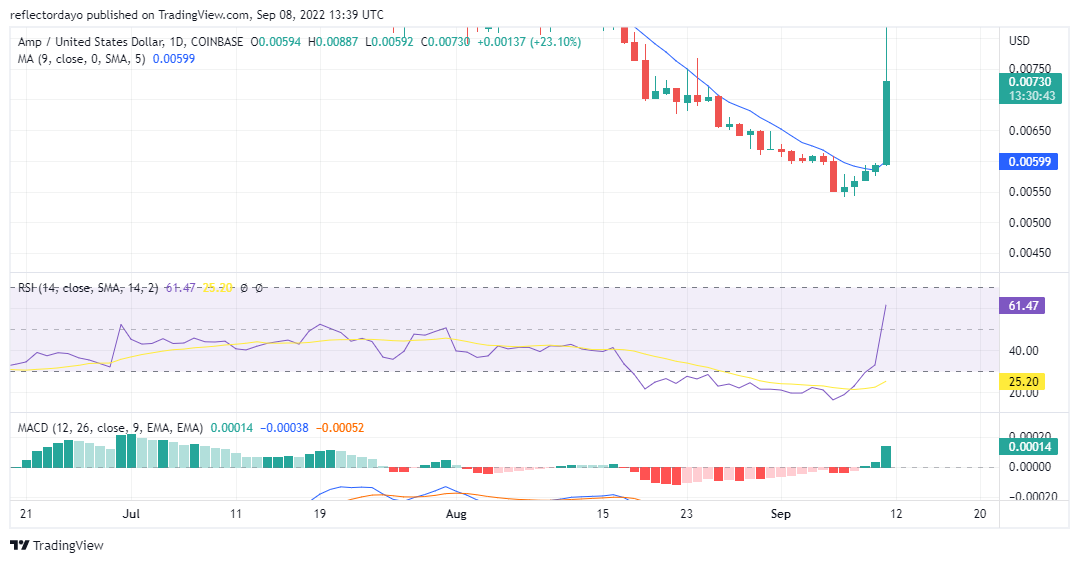
The AMP/USD downward trend started on the 17th of August, and it went on until the 7th of September. The trend ended with a very strong bearish market on the 6th of September. Bulls began to reclaim their ground in the market on the 7th of September. At some point in the market, sellers began to show signs of weakness. At the same time, the buyers were not strong enough to take the control of the market. But in the market today, buyers became strong enough to drive the price as far as the height of $0.008800, before sellers start to take profits. This made the price fall back below the resistance level of $0.00800. The price is now at the current price of $0.0073736. The long wick above the bullish candlestick for today’s market shows sellers’ formidability in the market. And this can make today’s market very volatile.
Amp Market Price Statistic:
- AMP/USD price now: $0.0073736
- AMP/USD market cap: $309,639,465
- AMP/USD circulating supply: 42,000,000,000
- AMP/USD total supply: 99,213,408,535
- AMP/USD coin market ranking: #112
Key Levels
- Resistance: $0.00750, $0.00800, $0.00850
- Support: $0.00550, $0.00500, $0.00450
Your capital is at risk
Amp Market Price Analysis: The Indicators’ Point of View
The indicators confirm the very strong bullish momentum in the market today. The MACD histogram shows a steady reduction in the selling pressure as the negative histograms reduces until it becomes positive histograms. Today’s histograms represent the bullish aggression in the bid for market dominance as the height of today’s MACD histogram is much greater than the previous histograms of the past two days. In support of this, The Relative Strength Index also saw a very rapid line retracement from the oversold region. However, the signal line is still in the downtrend. The signal line, even though it is slow, also have to show signs of response by following the direction RSI line so that the uptrend can be confirmed.
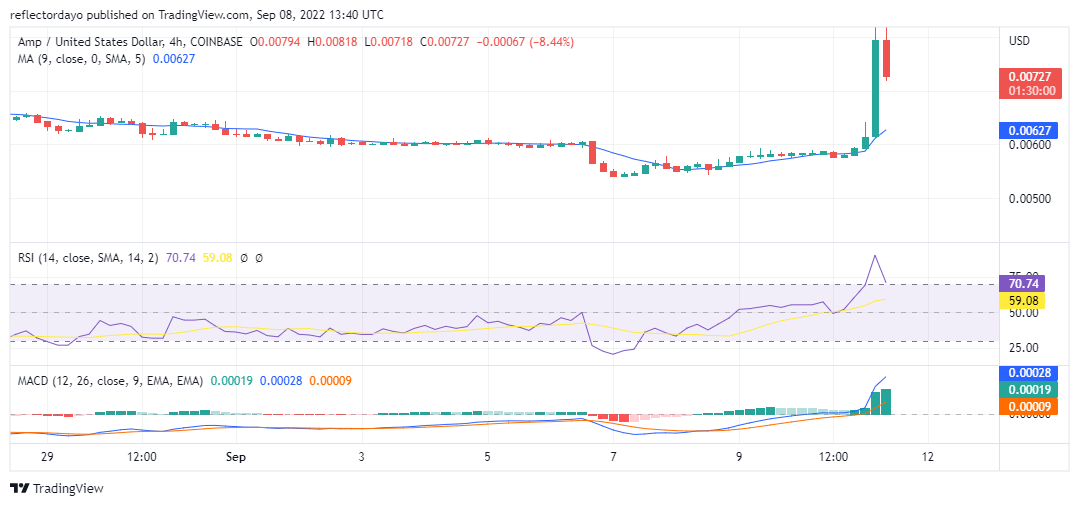
AMP/USD 4-Hour Chart Outlook
Although the buyers are showing great strength, the sellers also are proving their formidability in today’s market. The market was initially bullish before sellers forced down the price until they took the control of the trading session. But for now, bulls appear stronger than bears. The price decline is reflected in the RSI indicator as the RSI line falls back to 74%. But not much of the price decline was reflected in the MACD. Currently, Buyer are still fighting back to take the market
Related
Join Our Telegram channel to stay up to date on breaking news coverage