Join Our Telegram channel to stay up to date on breaking news coverage
Although today’s COMP/USD market looks bearish because the candlesticks are red, In an actual sense, the market is bullish. And also, there is a high level of market indecision reflected in today’s chart. But on the contrary, buyers are still bidding for a higher price. Sellers are not able to drive the price too much to the lower price. At the moment, after the bearish move in today’s market, the price appears fixed because of market indecision.
Compound Market Price Statistic:
- COMP/USD price now: $54.74
- COMP /USD market cap: $404,707,611
- COMP/USD circulating supply: 7,261,273.87
- COMP/USD total supply: 10,000,000
- COMP/USD coin market ranking: #95
Key Levels
- Resistance: $56.00 $57.00 $ 58.00
- Support: $54.00,
- $53.00, $52.00
Your capital is at risk
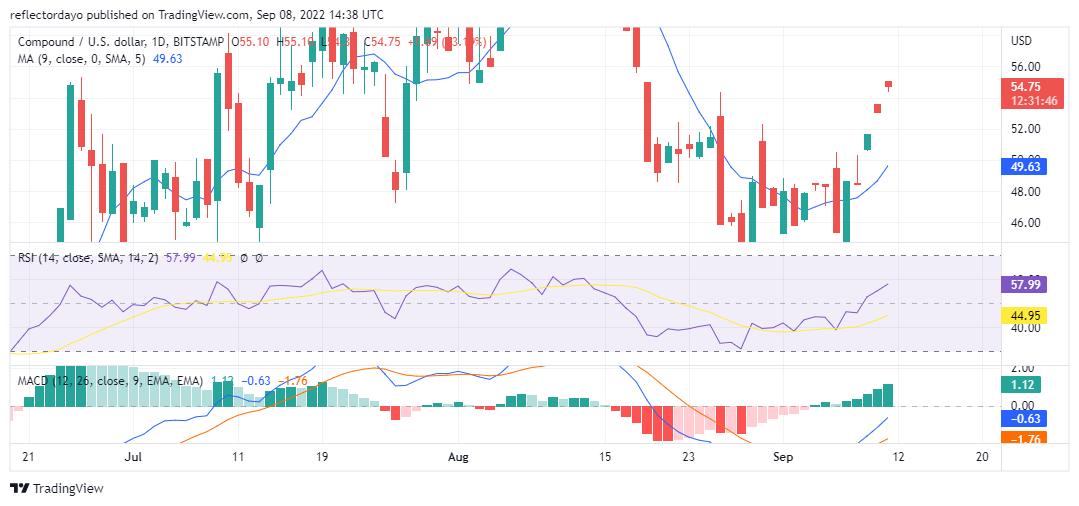
Compound Market Price Analysis: The Indicators’ Point of View
From a broader view of the market chart, From mid-August, we can see that the bearish candlesticks are very strong. Buyers could not resist the selling pressure up until late August. By late August the buying pressure became strong enough to make the market range sideways briefly. Then buyers began to drive the price up. The RSI line remains at 57.99%, while the signal line (being the slower line) is still in the weak zone of the indicator measuring 44.95%. The MACD line has crossed the MACD signal line on the downside. This indicates that the trend had changed in favour of bulls. And the progressive histograms in the MACD portray the bullish strength.
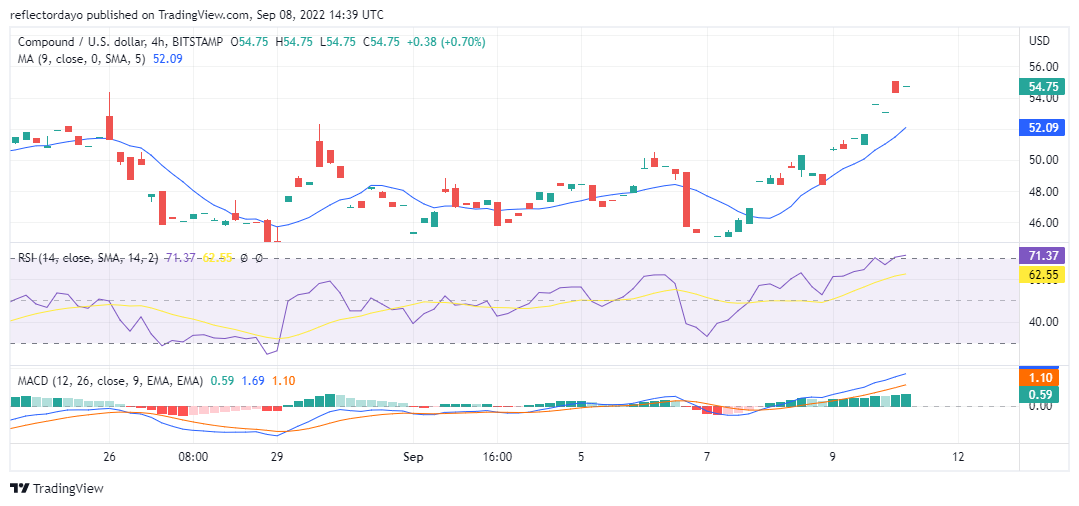
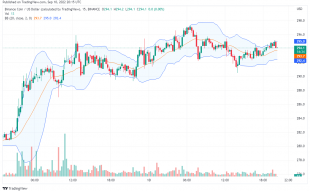
Compound: COMP/USD 4-Hour Chart Outlook
We can only see two sessions reflected on this chart. The first one started with great selling pressure, but along the line, the buyers tried to reclaim their ground. They could not do that until the session closed. The next candle is a 4 price doji candlestick. This is showing a high level of indecision among buyers and sellers. And as a result of this, the price remains at $54.75.
Related
Join Our Telegram channel to stay up to date on breaking news coverage