Join Our Telegram channel to stay up to date on breaking news coverage
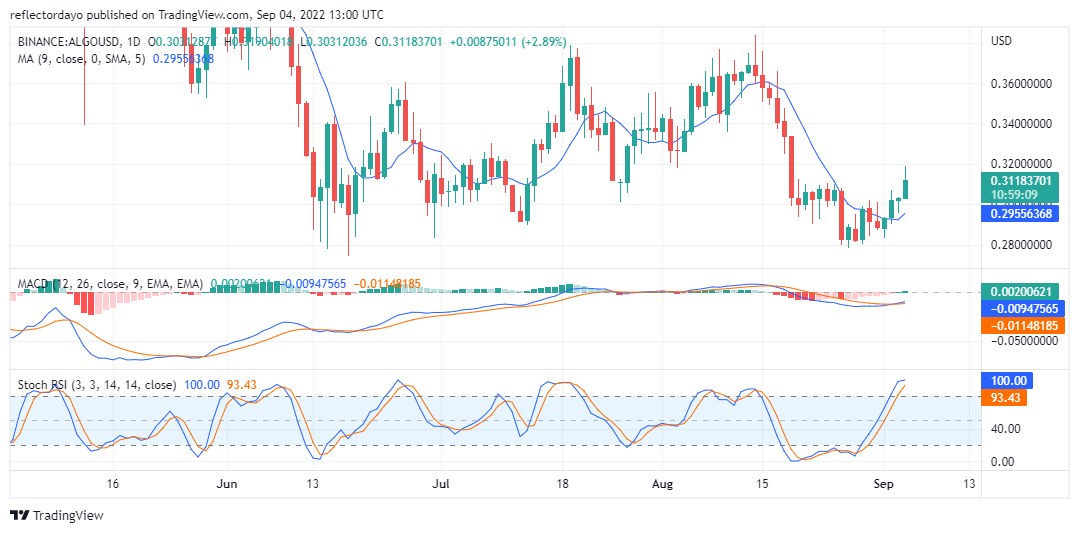
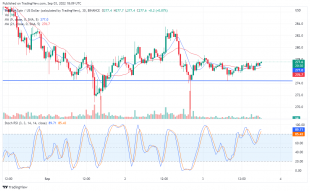
On the 29th of August, a bullish engulfing candlestick pattern signals the end of ALGO/USD downtrend. The sellers made efforts to prevent the price from swinging in favour of the buyers as the next two days were taken by them. However, the bearish market momentum did not last as the market from the 1st of September has been a bullish market. Yet pressures from sellers can still be observed in the candlestick patterns. Nevertheless, each of the three days in September has been bullish.
Algorand Market Price Statistic:
- ALGO/USD price now: $0.31228848
- ALGO /USD market cap: $2,153,248,023
- ALGO /USD circulating supply:6.90Billion
- ALGO /USD total supply: 7,321,538,895
- ALGO /USD coin market ranking: #30
Key Levels
- Resistance: $0.320000000, $0.33368313 $0.34000000
- Support: $0.30000000, $0.29351949, $0.28243986
Your capital is at risk
Algorand Market Price Analysis: The Indicators’ Point of View
With the help of an indicator, we should be able to predict the expected market price direction. In the Moving Average Convergence and Divergence indicator, we can see how rapid the market price recovered from the negative side. This shows how strong the bullish momentum is. The Stochastic RSI indicator (being a fast indicator) was even quicker to discover that the trend of the market will swing high. Therefore, if this new uptrend will change soon, we should be able to discover it from the stochastic. As we can see from the stochastic, it does not seem like the trend will change soon. Although the price is in the overbought if the buying pressure continues the lines can linger in the overbought zone for a while. There is a high probability that the trend will continue
Algorand Analysis: ALGO/USD 4-Hour Chart Outlook
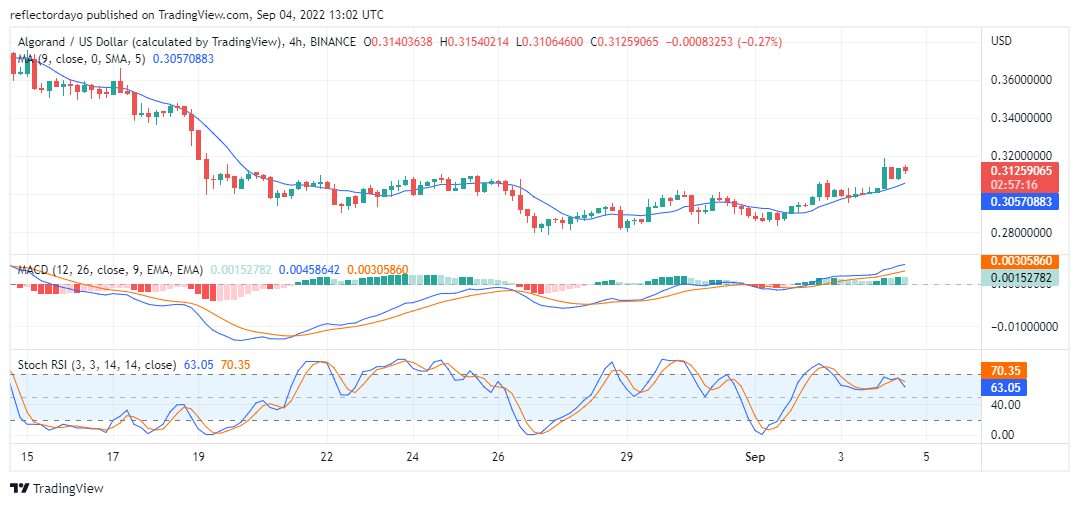
The first session was very bullish. But towards the end of the first 4-hour trading session, bears returned and this resulted in a complete bearish second session. In the third session buyers takes over totally. There is almost no sign of bearish activities in the third session. The lines of the MACD did not reflect these small market swings, but the histogram was quick to reflect the swing. We can tell from the colour of the histogram. A faded green histogram means a weakening uptrend.
Related
Join Our Telegram channel to stay up to date on breaking news coverage
