Join Our Telegram channel to stay up to date on breaking news coverage
The Cardano price prediction reveals that ADA may find a halt at $0.40 as the price is down by 0.96% after touching the daily high of $0.48.
Cardano Prediction Statistics Data:
- Cardano price now – $0.45
- Cardano market cap – $15.5 billion
- Cardano circulating supply – 34.2 billion
- Cardano total supply – 34.9 billion
- Cardano Coinmarketcap ranking – #8
ADA/USD Market
Key Levels:
Resistance levels: $0.55, $0.60, $0.65
Support levels: $0.35, $0.30, $0.25
Your capital is at risk
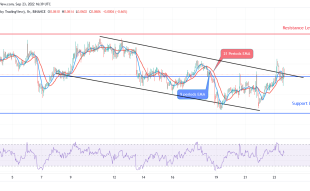
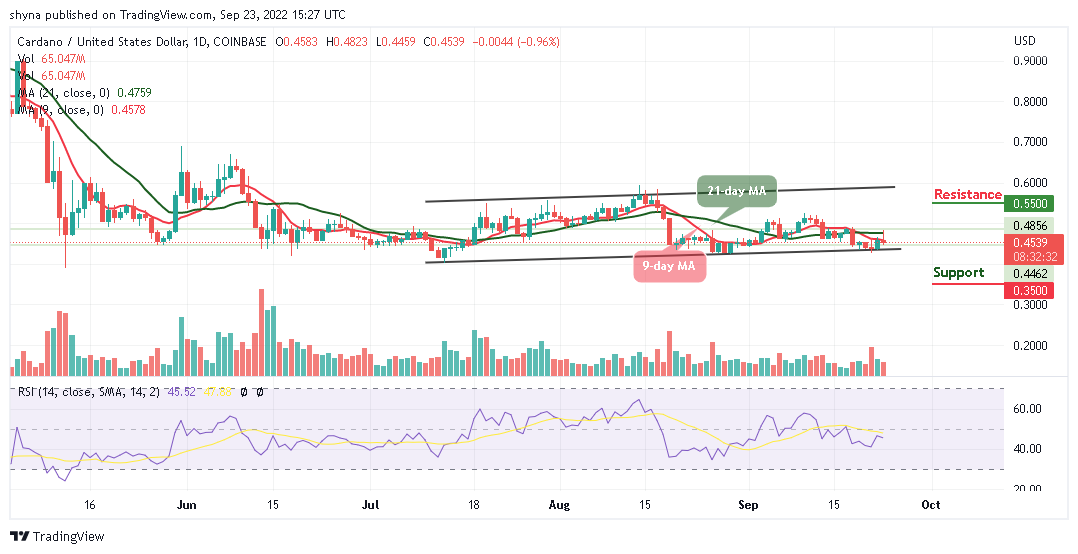
ADA/USD price may drop further lower to find support at the $0.40 level as the daily chart reveals that the Cardano price may go lower before rising again. Therefore, if the bears continue to push the market further lower, immediate support below the $0.43 level may be located. Beneath this, further supports may be found at $0.35, $0.30, and $0.25.
ADA Price Faces the South as TAMA Increases
As the daily chart reveals, if the buyers can hold the support at $0.45 which is the current market value, the Cardano price may begin to climb higher, and bulls could expect immediate resistance to be located above the 9-day and 21-day moving averages.
However, any bullish movement towards the upper boundary of the channel may locate the higher resistance levels at $0.55, $0.60, and $0.65. Meanwhile, the technical indicator Relative Strength Index (14) is likely to cross below the 40-level, which shows that the market price may drop more.
Against Bitcoin, the Cardano price is moving to the upside above the 9-day and 21-day moving averages, likely to cross above the upper boundary of the channel. Therefore, should the price cross above the channel, the market could hit the resistance level at 2600 SAT and above.
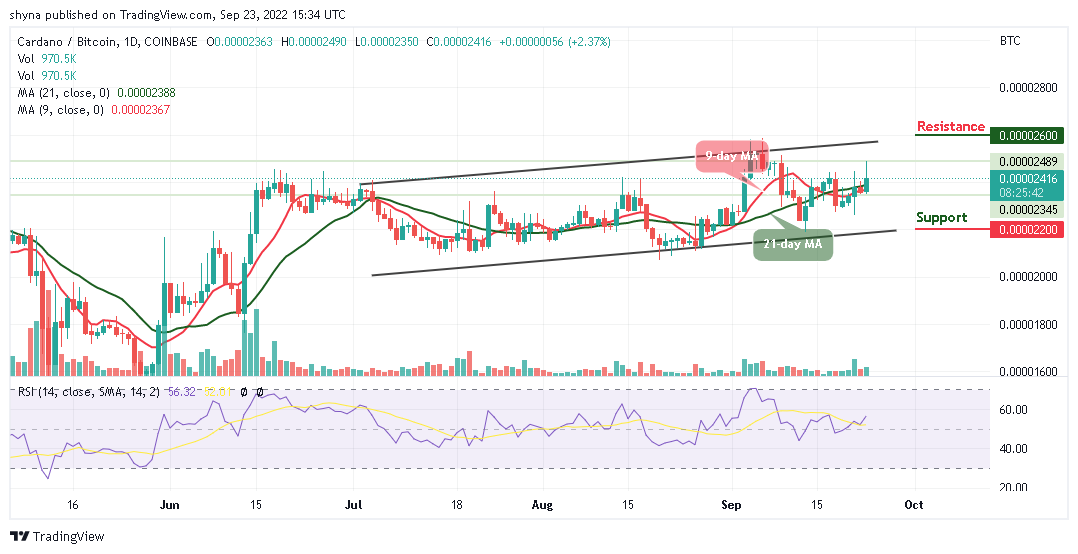
On the contrary, if the bulls failed to push the market towards the north, it may cross below the moving averages to face the lower boundary of the channel. If successful, ADA price may reach the support level of 2200 SAT and below. More so, the technical indicator Relative Strength Index (14) confirms that the market is been controlled by the buyer as the signal line moves to cross above the 60-level.
Related:
Join Our Telegram channel to stay up to date on breaking news coverage