Join Our Telegram channel to stay up to date on breaking news coverage
Bitcoin has soared to new heights, reaching $30,000, and surging over $5,000 within just a week after successfully testing the support level of $25,000.
The breakthrough above the $30,000 psychological barrier carries more significance than mere numbers. It marks a turning point on the monthly price charts, instilling a bullish sentiment unseen since August 2021.
Furthermore, the ascent above a persistent technical resistance level, which has hindered bullish advances for months, further fuels the crypto market’s potential. With these obstacles cleared, the sky seems to be the limit in the soaring crypto landscape.
Bullish Crossover Triggers Bitcoin Above $30,000
As anticipated by analysts, Bitcoin is mirroring the trajectory of stocks, indicating a possible bullish market surge. Recent days have witnessed an upward trend, propelling the price to soar past $30,000 once again.
Currently, the focus lies on solidifying support above this crucial level, as price action seeks to consolidate its position and inspire further confidence among investors.
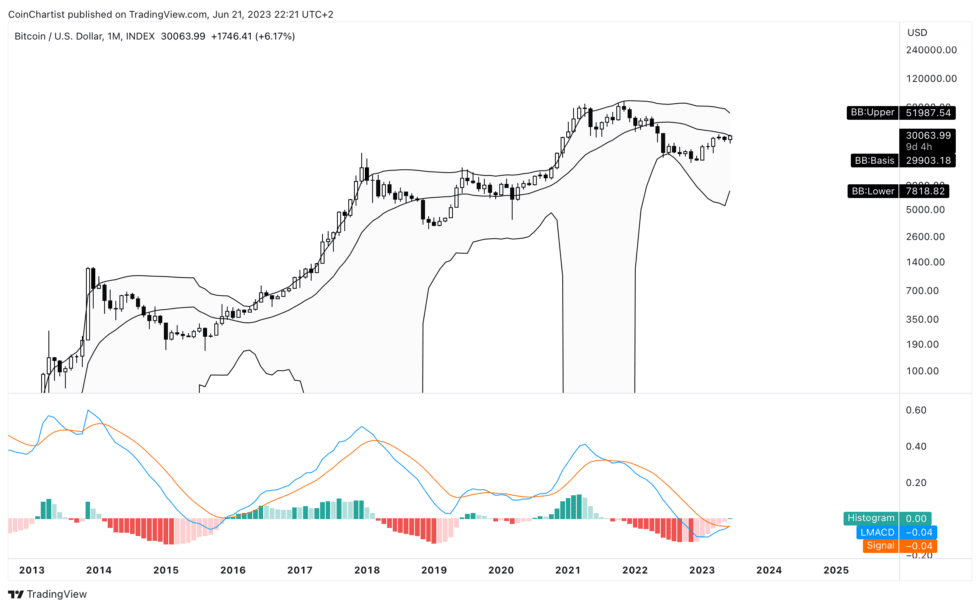
Bitcoin’s sudden surge of over 6% against the US dollar has sparked optimism in the market, as the LMACD indicator hints at a potential bullish trend reversal. With the first green tick appearing on the LMACD since its bearish turn in August 2021, investors eagerly anticipate a renewed upward momentum for BTCUSD.
A bullish crossover in technical analysis happens when the LMACD line, a trend-following indicator, intersects the signal line from a lower position, indicating potential upward momentum.
To validate this signal, a monthly close is required to confirm the crossover, and it’s advisable to observe multiple monthly closes for a higher level of confidence in the trend reversal.

The Next Level of Bollinger Band Confluence Could Be $50k
Technical analysts seek a confluence of signals to enhance their analysis. When a morning star Japanese candlestick reversal pattern forms at a support level and coincides with oversold conditions in the RSI, it becomes a particularly significant indication. Such synergistic alignments empower analysts with stronger insights into potential market reversals.
These patterns indicate a reversal in the trend, and when they appear along with other indicators, such as the RSI, analysts are more confident in their predictions.
Multiple signals’ confluence gives them more certainty that prices will reverse, and they can take advantage of the situation.
The chart reveals an intriguing scenario as Bitcoin approaches the critical resistance level of $30,000 while aligning with the monthly Bollinger Band basis line.
The recent crossover of the monthly LMACD is added to the bullish sentiment, further fueling optimism about potential upward movement in Bitcoin’s price. Traders and investors eagerly await the outcome of these converging factors as they analyze the market for potential opportunities.
With BTCUSD surpassing the monthly “mid-BB” level, the upper Bollinger Band emerges as the next plausible objective. Presently positioned above $50,000 per BTC, it has historically acted as a target point after a bullish breakthrough past the median.
This is because of the tendency of the price to pull back to the upper band after a breakout. This suggests that a significant move higher could be in the making as the price continues to test the upper band. The high volatility of BTCUSD suggests that any pullback could be relatively short-lived.
In previous instances, Bitcoin eventually reached the upper band in the ensuing months. The question arises: Will this pattern continue, or will there be a deviation? Is $50,000 per coin the next destination in sight?
Join Our Telegram channel to stay up to date on breaking news coverage


