Join Our Telegram channel to stay up to date on breaking news coverage
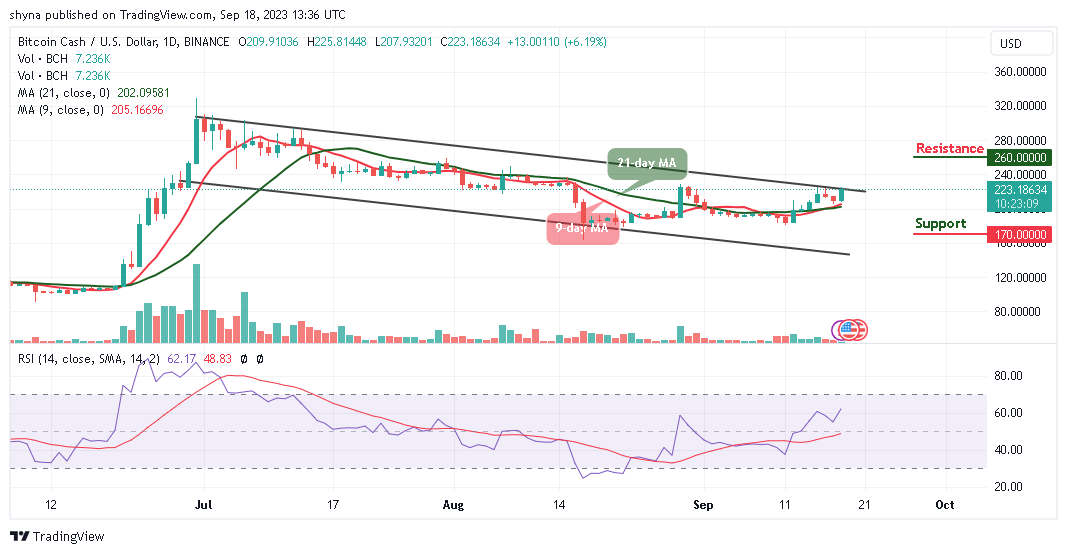
The Bitcoin Cash price prediction begins a decent recovery wave above $220 as the coin approaches a major hurdle near $230.
Bitcoin Cash Prediction Statistics Data:
- Bitcoin Cash price now – $223.1
- Bitcoin Cash market cap – $4.2 billion
- Bitcoin Cash circulating supply – 19.5 million
- Bitcoin Cash total supply – 19.5 million
- Bitcoin Cash Coinmarketcap ranking – #18
BCH/USD Market
Key Levels:
Resistance levels: $260, $270, $280
Support levels: $170, $160, $150

BCH/USD is in the hands of the bulls as the coin remains above the 9-day and 21-day moving averages. However, the bulls may need to gather enough energy to push the coin to cross above the upper boundary of the channel. The technical indicator Relative Strength Index (14) is also moving above the 60-level with the signal line pointing to the north, suggesting upward movement.
Bitcoin Cash Price Prediction: BCH May Spike to the Upside
Looking at the daily chart, the Bitcoin Cash price is ready to break into the upside as the 9-day MA crosses above the 21-day MA. Meanwhile, the more the bulls pressurized the bears, the higher the coin would reach. Therefore, if the bulls maintain the upward trend, BCH/USD may continue with the bullish movement which could take the coin to the resistance levels of $260, $270, and $280.
On the other hand, if the sellers return to the market, any strong selling pressure could drag the price below the moving averages, and should BTC trade below the daily opening price of $209.9, a bearish movement could take the price to the support levels at $170, $160, and $150.
BCH/BTC Trades Bullishly
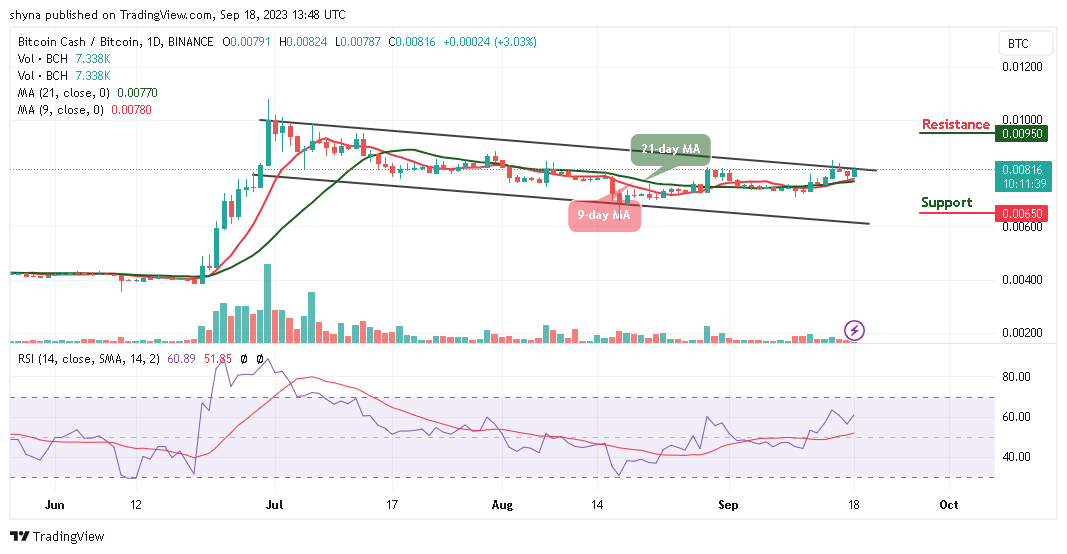
Against Bitcoin, the Bitcoin Cash is above the 9-day and 21-day moving averages as the bulls increase their entries within the market. At the time of writing, the Bitcoin Cash price has not been able to push the price above the upper boundary of the channel as it is currently trading at 816 SAT. If the Bitcoin Cash signals a bullish rally, it may likely meet resistance at 950 SAT and above.

Nonetheless, traders can see that the market may maintain the bullish movement as the technical indicator Relative Strength Index (14) moves to cross above the 60-level. In other words, any bearish movement toward the lower boundary of the channel could hit the support at 650 SAT and below.
Alternatives to Bitcoin Cash
The Bitcoin Cash price is in the hands of the bulls as the coin spikes above the 9-day and 21-day moving averages. However, the bulls could sustain higher growth leading to a retest of the broken resistance level at $225. The technical indicator Relative Strength Index (14) is likely to cross above 65-level with the signal line pointing to the north for more bullish signals.
On that note, the Wall Street Memes token has entered its conclusive stage, allowing you to invest at the current low presale rate before it’s traded on exchanges. As a result, it has raised over $25 million in presale as it awaits its official launch in the forthcoming days.
THIS IS THE TIME TO INVEST IN THIS MEMECOIN! ($WSM Review).
New OKX Listing - Wall Street Memes
- Established Community of Stocks & Crypto Traders
- Featured on Cointelegraph, CoinMarketCap, Yahoo Finance
- Rated Best Crypto to Buy Now In Meme Coin Sector
- Team Behind OpenSea NFT Collection - Wall St Bulls
- Tweets Replied to by Elon Musk
Join Our Telegram channel to stay up to date on breaking news coverage


