Join Our Telegram channel to stay up to date on breaking news coverage
The API3 price prediction shows that API3 is beginning to restart the uptrend after trading below the 9-day and 21-day moving averages.
API3 Prediction Statistics Data:
- API3 price now – $1.09
- API3 market cap – $93.8 million
- API3 circulating supply – 86.4 million
- API3 total supply – 125.3 million
- API3 CoinmarkAPI3ap ranking – #184
API3/USD Market
Key levels:
Resistance Levels: $1.30, $1.40, $1.50
Support Levels: $0.58, $0.48, $0.38

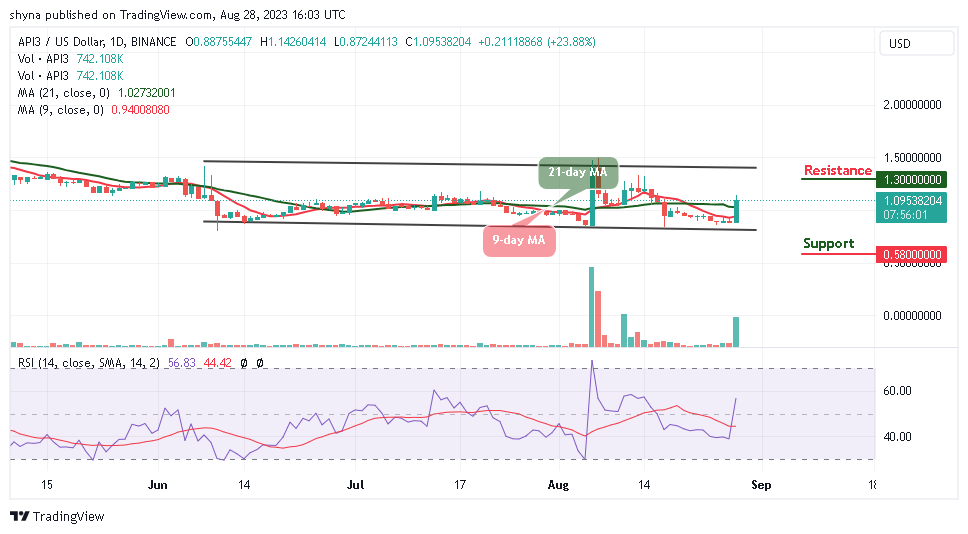
API3/USD looks green at the time of writing as the price hovers around the resistance level of $1.09. However, a daily close above the daily high of $1.14 may increase the API3 price to $1.20. Meanwhile, traders should note that a consistent price increase may bring more buyers into the market as bulls increase their positions.
API3 Price Prediction: Price May Continue to Break Higher
In the past few hours, after the API3 price crosses above the 9-day and 21-day moving averages, the coin has been looking forward to creating additional gains. Meanwhile, the daily chart reveals that if the 9-day moving average remains below the 21-day moving average, the coin may still come to the downside.
Nevertheless, the bears are likely to take the advantage to break below the lower boundary of the channel if the bulls fail to move the price upward but the technical indicator Relative Strength Index (14) is moving to cross above the 60-level, suggesting more bullish signals into the market. However, if the API3 price moves near the upper boundary of the channel, it could hit the resistance levels of $1.30, $1.40, and $1.50 but sliding below the lower boundary of the channel could bring the price to the supports at $0.58, $0.48, and $0.38.
API3/BTC May Create Additional Gains
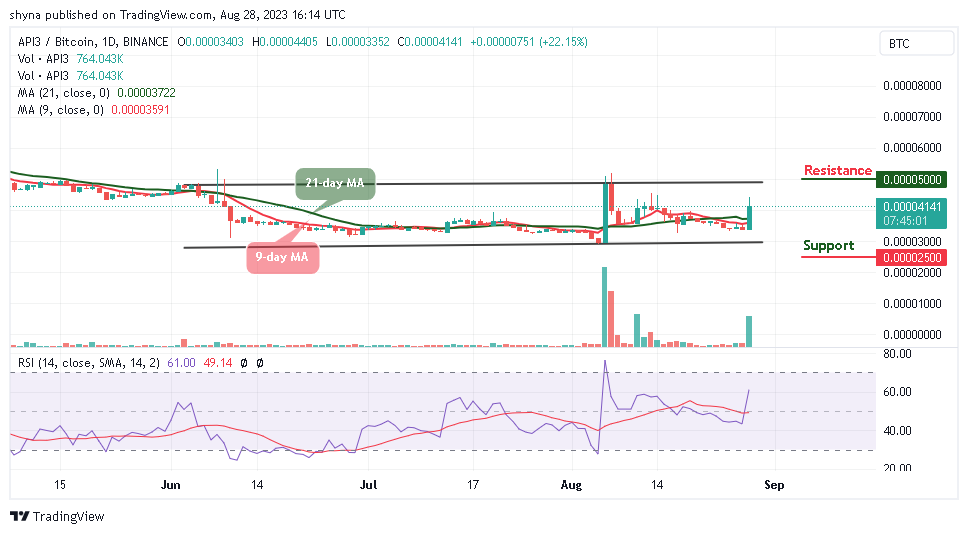
Against Bitcoin, the API3 price is hovering above the 9-day and 21-day moving averages. However, intraday trading ranges as the coin moves within the channel, breaking toward the upper boundary of the channel could push the coin to the resistance level at 5000 SAT and above.

On the contrary, if the sellers bring the market to the south, traders can expect a fall below the channel, breaking below this barrier may hit the support at 2500 SAT and below. Meanwhile, the technical indicator Relative Strength Index (14) crosses above the 60-level, suggesting bullish movement.
Alternatives to API3
API3/USD crosses above the 9-day and 21-day moving averages as the coin hit gains of over 22.15% in the last 24 hours. However, the coin is trading toward the upper boundary of the channel and may cross above this barrier if the bulls put in more effort while the technical indicator Relative Strength Index moves to cross above 60-level.
However, there are no team tokens as far as $WSM is concerned. Wall Street Memes has a very strong and vibrant community, and the best approach is to purchase the token now, not later. The presale success speaks volumes about the confidence that investors have already placed in $WSM, a confidence that is on the brink of being richly rewarded as over $25m raised so far.
New OKX Listing - Wall Street Memes
- Established Community of Stocks & Crypto Traders
- Featured on Cointelegraph, CoinMarketCap, Yahoo Finance
- Rated Best Crypto to Buy Now In Meme Coin Sector
- Team Behind OpenSea NFT Collection - Wall St Bulls
- Tweets Replied to by Elon Musk
Join Our Telegram channel to stay up to date on breaking news coverage


