
Join Our Telegram channel to stay up to date on breaking news coverage
The API3 price prediction shows that API3 is heading toward the upper boundary of the channel to create additional gains.
API3 Prediction Statistics Data:
- API3 price now – $1.311
- API3 market cap – $111.9 million
- API3 circulating supply – 85.4 million
- API3 total supply – 124.9 million
- API3 Coinmarketcap ranking – #199
API3/USD Market
Key Levels:
Resistance levels: $1.600, $1.700, $1.800
Support levels: $1.000, $0.800, $0.600
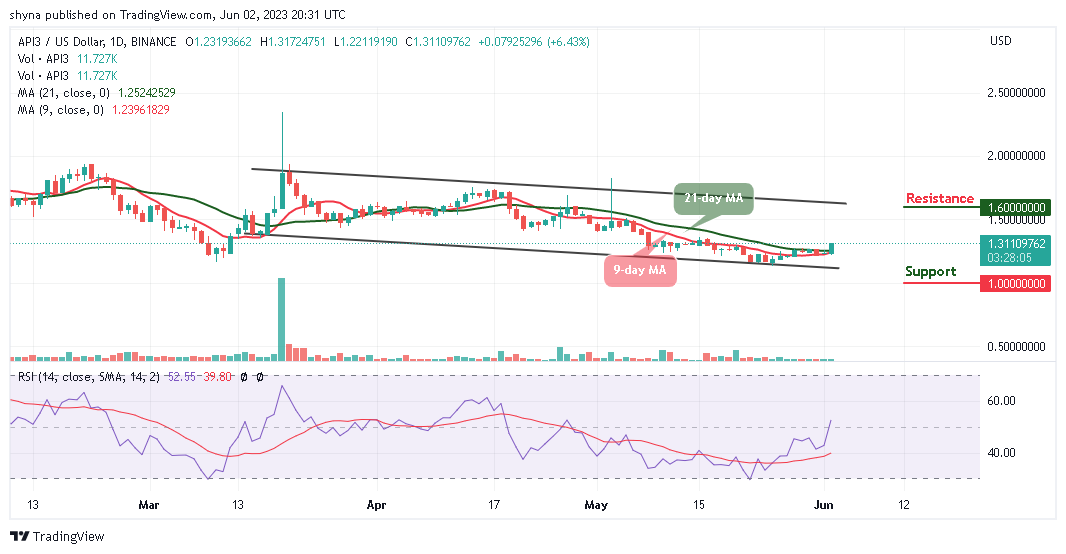
API3/USD has been maintaining a steady upside-moving trend with the possibility of progressive bullish price advancement. However, the coin has been putting on strong efforts aimed at regaining its bullish position in the market. Although the selling pressure has been very responsive to the bullish move, despite this, the buyers were able to conserve a measure of the bullish price in each of the recent trading sessions.
API3 Price Prediction: API3/USD Likely to Hit $1.500 High
The API3 price is likely to trend to the upside and the movement near the upper boundary of the channel could push the coin to the resistance levels of $1.600, $1.700, and $1.800. On the downside, a bearish movement below the lower boundary of the channel could stop the initial upward movement and create bearish momentum with a focus to bring the market to the next support levels of $1.000, $0.800, and $0.600 respectively.
At the moment, the technical indicator Relative Strength Index (14) crosses above the 50-level, which indicates that the market may follow an uptrend. Looking at the daily chart, the 9-day moving average is likely to cross above the 21-day moving average which could allow the buyers to concentrate on stirring action to the north.
Against Bitcoin, the API3 price hovers above the 9-day and 21-day moving averages, meanwhile, following the recent positive sign, the API3 price could rise further if the buyers sustain the buying pressure. However, if the bears resume and bring the coin below the lower boundary of the channel, the market price may touch the support level at 4000 SAT and below.
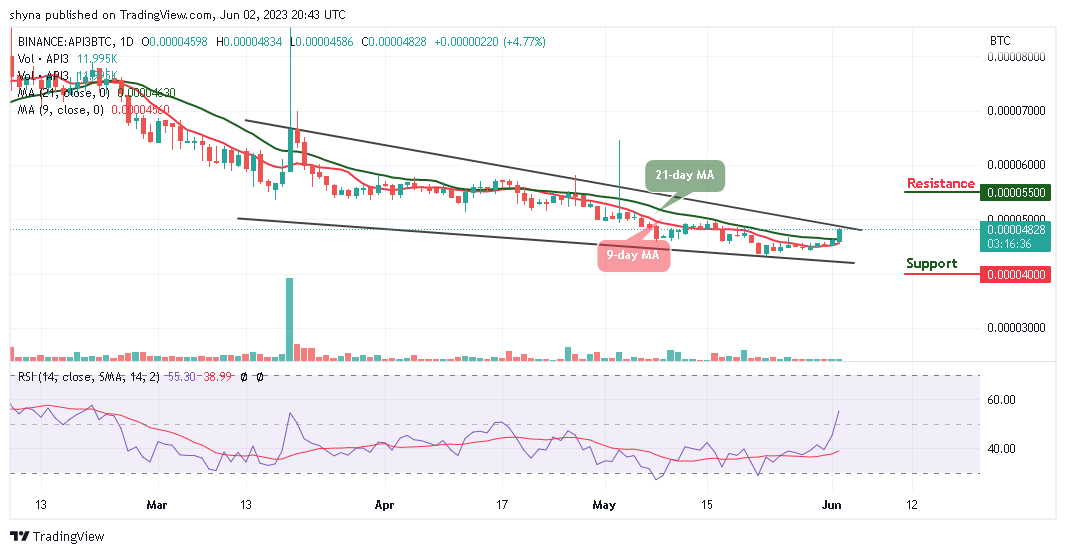
Meanwhile, any further positive move could push the coin above the upper boundary of the channel to hit the resistance level of 5500 SAT and above. The technical indicator Relative Strength Index (14) is likely to cross above the 60-level as this could boost the bullish movement within the channel.
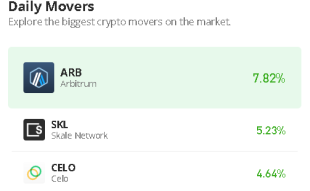
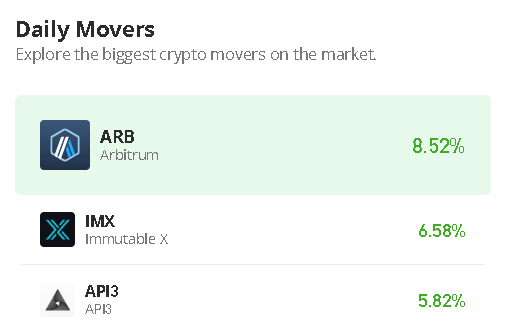
API3 Alternatives
There is growing interest in buying and selling API3. But as we can see from the chart, traders are buying the market more than they are selling the market. The Relative Strength Index signal line is measuring above 50% as there could be room for more bullish price action. However, now that the Wall Street Memes team has entered the crypto market, anticipation is already building as investors are eager to see if the launch of $WSM can replicate the success of the NFT collection. Moreover, since the launching of the presale, the token has raised almost $3m so far.
Read more:
- Ethereum Price Prediction: ETH/USD Settles Above $355 After Testing the Critical Support
- Bitcoin Price Prediction: BTC/USD Attempts to Breach $9,000 Resistance as Bulls Intend to Emerge
New OKX Listing - Wall Street Memes

- Established Community of Stocks & Crypto Traders
- Featured on Cointelegraph, CoinMarketCap, Yahoo Finance
- Rated Best Crypto to Buy Now In Meme Coin Sector
- Team Behind OpenSea NFT Collection - Wall St Bulls
- Tweets Replied to by Elon Musk
Join Our Telegram channel to stay up to date on breaking news coverage