Join Our Telegram channel to stay up to date on breaking news coverage
ETH Price Prediction – September 29
The technical indicator shows that the second-largest cryptocurrency may start following sideways movement.
ETH/USD Market
Key Levels:
Resistance levels: $410, $412, $414
Support levels: $300, $298, $296

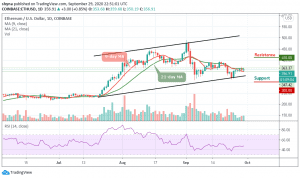
ETH/USD, the second-largest cryptocurrency with the current market capitalization of $40.33billion, may continue to be range-bound. Recently, the coin faced stiff resistance on approach to psychological $355 and settled at $356.91 at the time of writing. ETH/USD is currently gaining about 0.85% on a day-to-day basis after touching the daily low of $350.
Where is ETH Price Going Next?
At the time of writing this article, ETH/USD buyers have retained the control of the market. For the past few weeks, there has been a resounding victory for the bears as Ethereum’s price dipped down, breaking below the 9-day and 21-day moving averages before rebounding to where it is currently trading at the moment as the daily breakdown shows that ETH/USD may be following an uptrend movement.
However, for a backward movement, the market can be supported at $300 and $280 levels, if the price falls below the previous levels; another support is around $260. But should in case the price exceeds the indicated level by breaking above the moving averages, the resistance levels of $410, $412 and $414 may be visited. The technical indicator RSI (14) may likely cross into the positive side by moving above 50-level, which could give more bullish signals into the market.
Against Bitcoin, Ethereum is currently changing hands at 3316 SAT after witnessing some slightly bearish moment yesterday. However, looking at the daily chart, the current trend of the coin is ranging in the short-term, trading around the 9-day and 21-day moving averages within the channel.
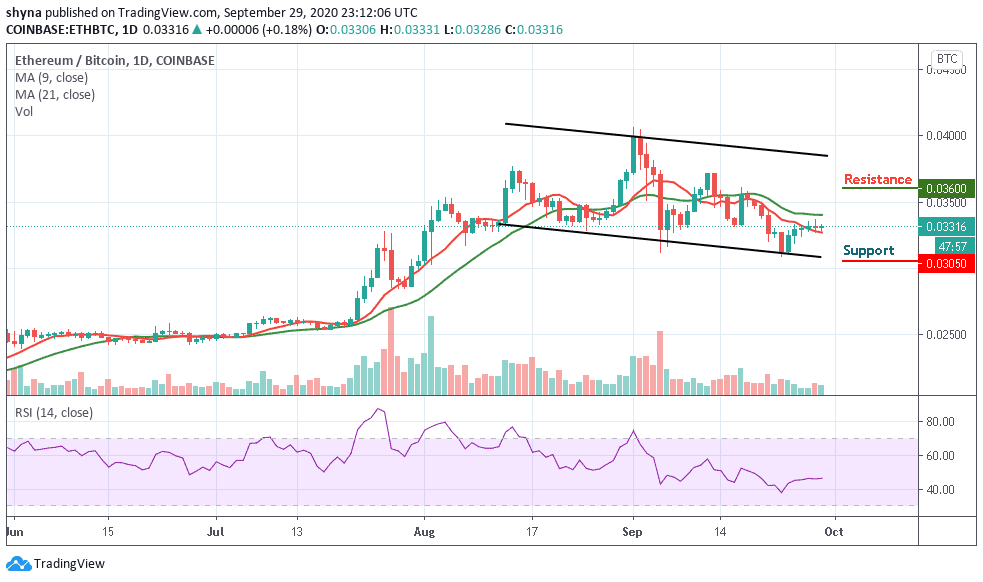
Meanwhile, as the price moves within the channel, the resistance levels to look for lies above the moving averages at 3600 SAT and 3700 SAT while the closest support levels to keep an eye on are 3050 SAT and below. The RSI (14) is seen moving on the same direction, causing the market to be indecisive at the moment.
Join Our Telegram channel to stay up to date on breaking news coverage