Join Our Telegram channel to stay up to date on breaking news coverage
BCH Price Prediction – August 9
For now, BCH/USD is mainly in the hands of the bulls as they eye action towards the $230 resistance level.
BCH/USD Market
Key Levels:
Resistance levels: $245, $255, $265
Support levels: $205, $195, $185
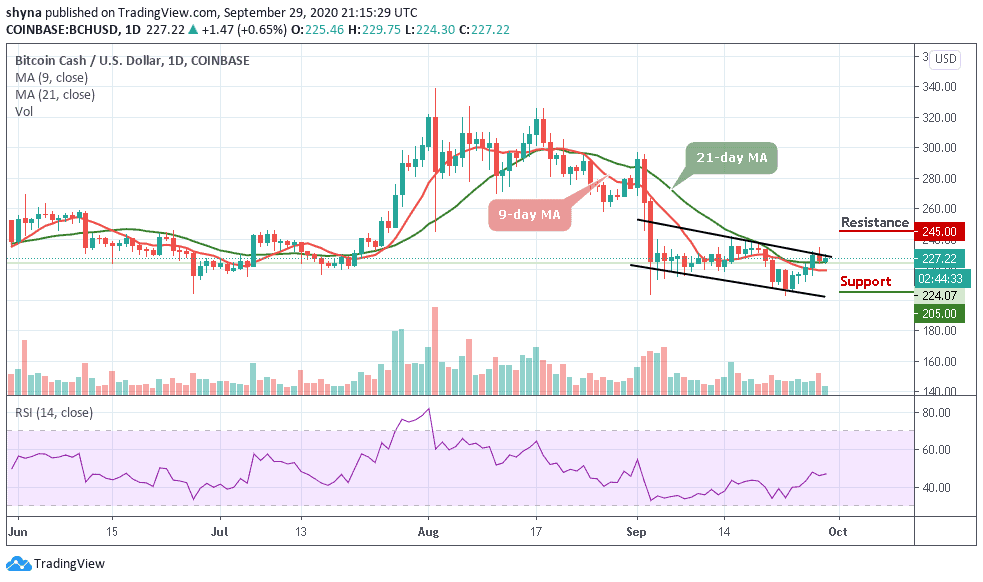
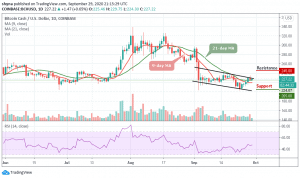
BCH/USD buyers are extending the price action above $225 as the coin hovers at $227.22 at the time of writing following a consistent bullish action since September 24. Meanwhile, all indicators are yet to align for a perfect bullish storm, starting with the 9-day MA that stays below the longer-term 21-day MA. Besides function as key support areas, the widening gap between the moving averages emphasizes the bearish momentum building in the market. The RSI (14) is also around the 47-level, suggesting sideways movement.
What to Expect from Bitcoin Cash (BCH)
BCH/USD is currently trading above 9-day and 21-day moving averages, the market price is expected to rise above the upper boundary of the channel if the technical picture remains intact in the near term, gains eyeing $240 could also start to materialize. It is also essential that bulls establish support above $230 to ensure that progress made above $220 is not wasted.
Nevertheless, the next resistance is located at around $235. Once it is out of the way, the upside is likely to gain traction with the next focus on psychological $245, $255, and $265 resistance levels. Considering that the price regained ground above 21-day MA at $225, the bullish scenario looks credible at this stage. On the downside, the correction may be extended below the moving averages. If it is broken, $205 may come into focus. Once it is out of the way, the sell-off may be extended towards $195 and $185 supports.
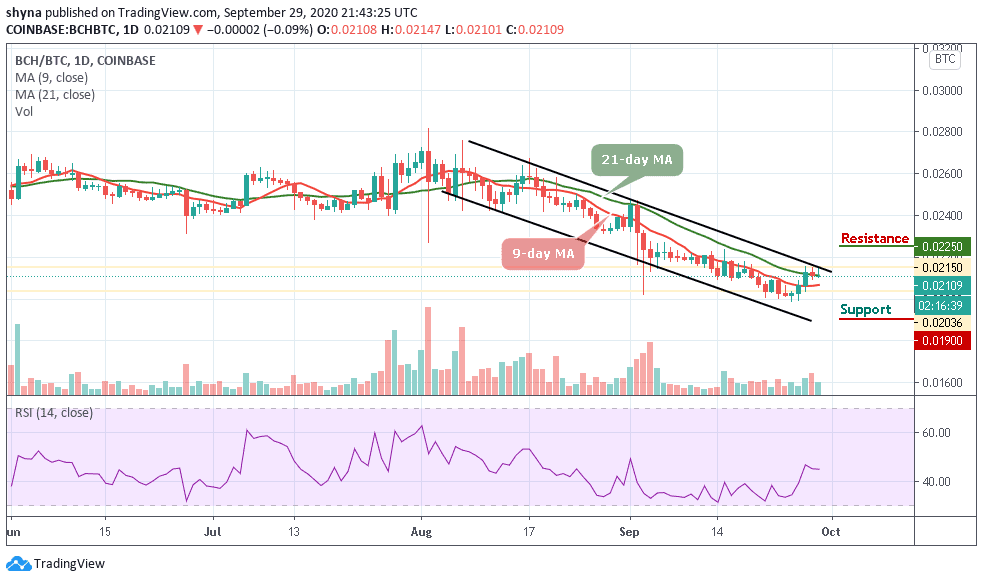
Against BTC, if the bulls succeeded in breaking above the 21-day moving average and cross above the upper boundary of the channel, the market price may likely reach the next resistance level of 2250 SAT and 2350 SAT. In other words, a retest could allow the pair to go below the 9-day moving average and lower the price to 1900 SAT and 1800 SAT support levels. Presently, the RSI (14) is moving in the same direction, suggesting sideways movement for the coin.
Join Our Telegram channel to stay up to date on breaking news coverage
