Join Our Telegram channel to stay up to date on breaking news coverage
The Ankr price prediction shows that ANKR manages to maintain its position as the bulls maintain the desire to shoot to the upside.
ANKR Prediction Statistics Data:
- ANKR price now – $0.032
- ANKR market cap – $320.8 million
- ANKR circulating supply – 9.66 billion
- ANKR total supply – 10 billion
- ANKR Coinmarketcap ranking – #104
ANKR/USD Market
Key Levels:
Resistance levels: $0.040, $0.042, $0.044
Support levels: $0.022, $0.020, $0.018
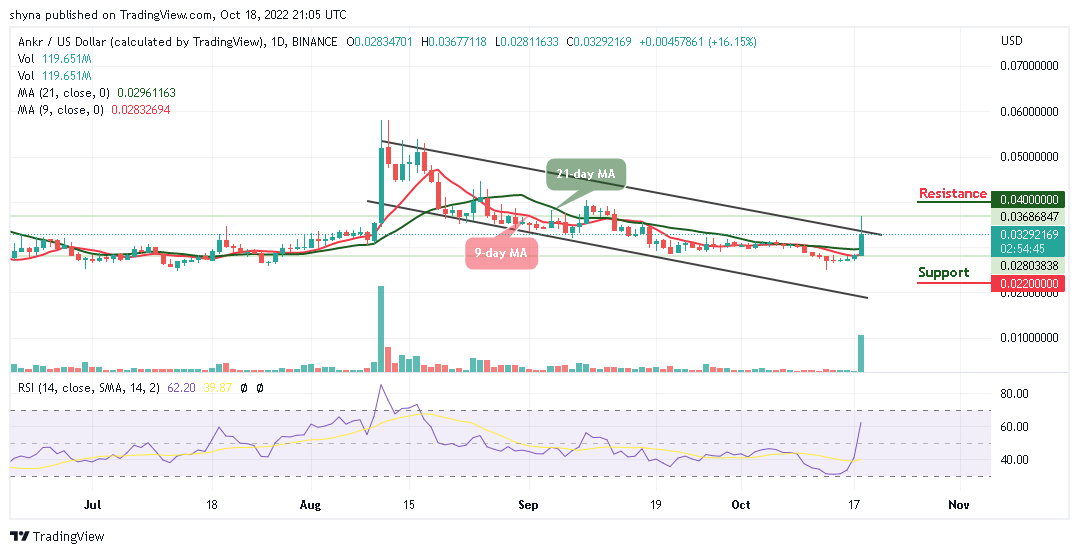
After being locked below the 9-day and 21-day moving averages, ANKR/USD is still undergoing a much-needed break to the positive side posting a tremendous gain of over 16.15% in the last 24 hours, with the coin trading above the 9-day and 21-day moving averages.
Ankr Price Prediction: Where will ANKR Price Go Next?
The Ankr price may continue with the bullish movement after touching the daily high of $0.036 during the European session today. The coin is now roaming around the upper boundary of the channel to continue a movement toward the resistance level of $0.038. Looking at the daily chart, traders can see the trading volume is rising as this may cause the bulls to increase the buying pressure.
On the other hand, if ANKR/USD decides to stay under the control of bears, the price may likely fall towards the lower boundary of the channel which could hit the supports at $0.022, $0.020, and $0.018. But as the Relative Strength Index (14) faces the north, crossing above the 70-level may cause the coin to reach the potential resistance levels at $0.040, $0.042, and $0.044 respectively.
Against Bitcoin, the Ankr (ANKR) begins to spike north as the coin moves above the 9-day and 21-day moving averages. On the contrary, if the sellers step back into the market, ANKR/BTC is likely to fall towards the nearest support level of 150 SAT and the critical support level could be located below the lower boundary of the channel at 120 SAT and below.
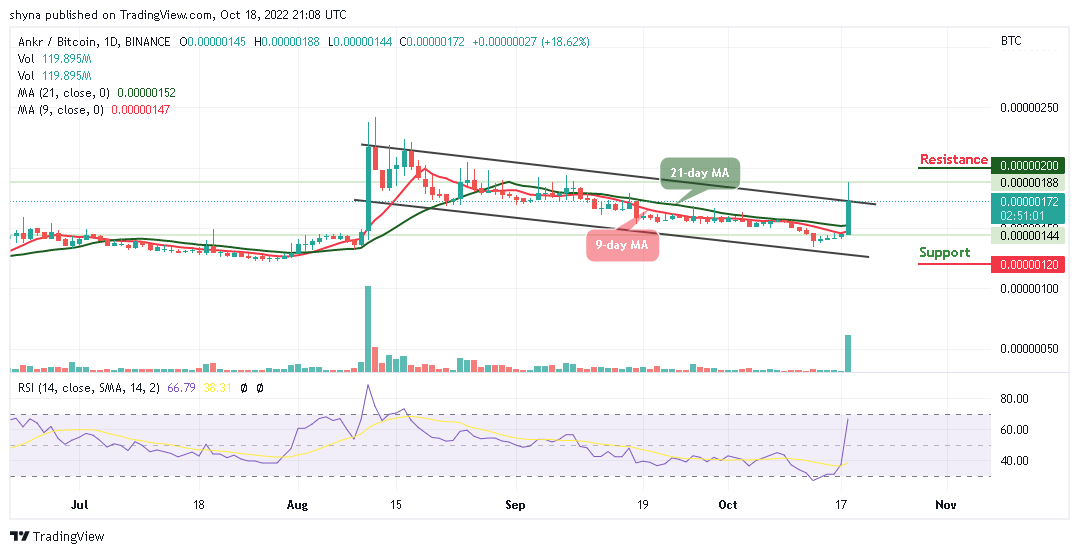
However, as the coin heads to the upside, any attempt by the bulls to continue the bullish movement, the coin may cross above the 9upper boundary of the channel which could find the resistance level of 200 SAT and above. Meanwhile, the coin is currently changing hands at 172 SAT and a spike in volatility may occur as the Relative Strength Index (14) is likely to cross into the overbought region.
Related:
Join Our Telegram channel to stay up to date on breaking news coverage
