Join Our Telegram channel to stay up to date on breaking news coverage
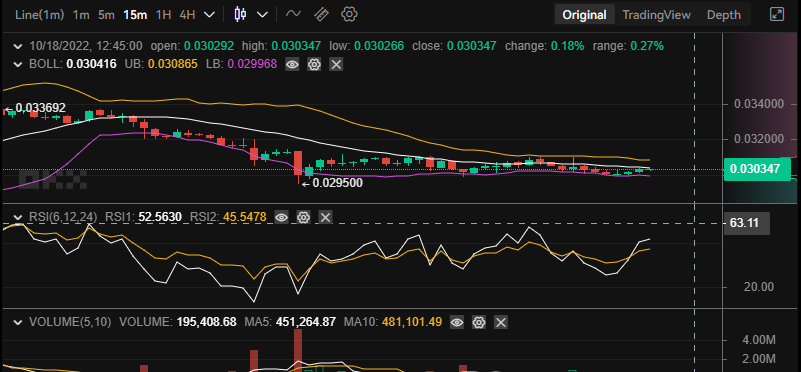
In yesterday’s market, after the Tamadoge price ranged sideways for some time (with a reducing distance between the support and resistance level), the market had a breakout to the downside before the price begin to rise upward. Yesterday’s bullish market reached the height of $0.0348 before the price begin to fall. In today’s market, the price begins to move in favour of the sellers until 4 am In the early hours of today after the market reached the lowest point of $0.0295.
Tamadoge Market Price Statistic:
- TAMA/USD price now: $0.0324
- TAMA/USD market cap: $37,417,929
- TAMA/USD circulating supply:1.05Billion
- TAMA/USD total supply: 1,049,733,333
- TAMA/USD coin market ranking: #2674
Key Levels
- Resistance: $0.0400, $0.0500, $0.0600
- Support: $0.0300, $0.0400, $0.0450
Tamadoge Market Price Analysis: The Indicators’ Point of View
From the $0.0295 price level, the market begins a sideway-ranging market trend. As the market trend progresses, the Bollinger band begins to reduce proximity between the upper and the lower bands. What should follow this price consolidation is a bullish price breakout just as it happened in yesterday’s market.
Tamadoge: TAMA/USD 5-Minute Chart Outlook
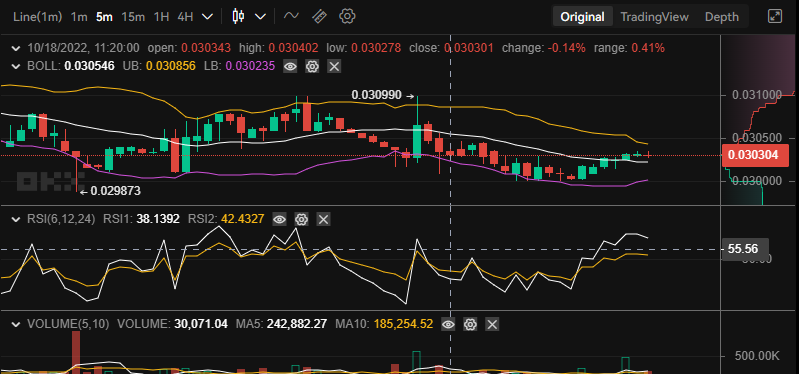
From this time frame, investors can discover the right time to enter the market for a profitable long trade. The TAMA price action progressively rises from the base of the Bollinger indicator; however, as it rises above the moving average it looks like sellers are becoming stronger and they are resisting the bullish advances to the upside. At this point, the candlestick pattern for each 5-minute session appears in dojis. It is either the consolidation period continue or the price breaks out in favour of the sellers again before. After this, it will go in favour of the bulls Just like yesterday’s market.
Related
Join Our Telegram channel to stay up to date on breaking news coverage


