Join Our Telegram channel to stay up to date on breaking news coverage
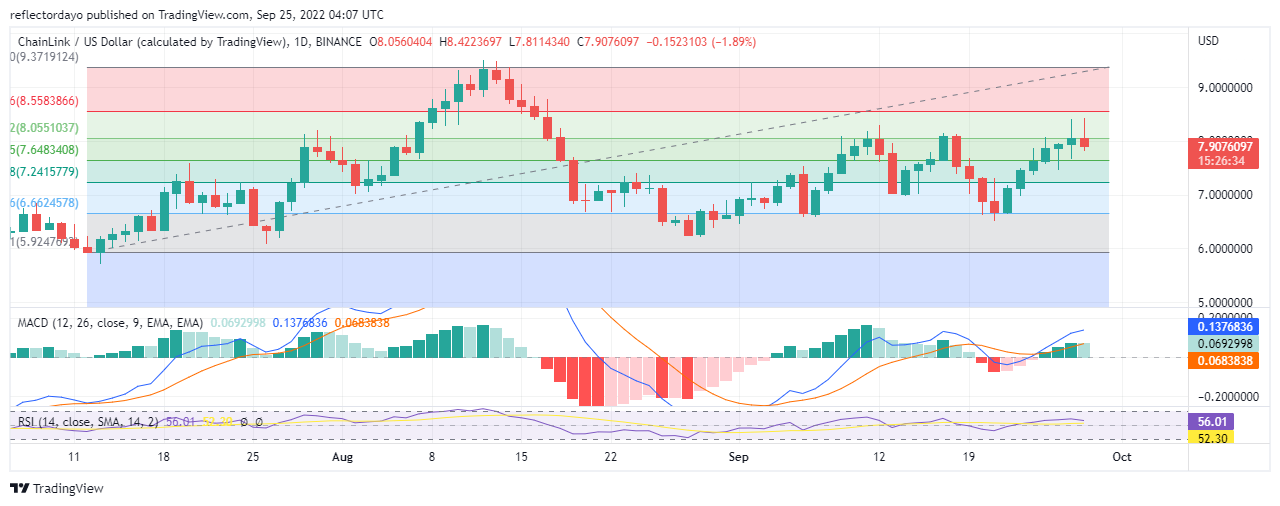
LINK/USD Bears are beginning to show more strength than the bulls and this is bringing the up-trend to an end. The outlook of today’s candlestick is that of an Inverted hammer. At this point, more traders are ready to sell than to buy. As a result of this, the market is now finding new resistance at $8.0534075
Chainlink Market Price Statistic:
- LINK/USD price now: $7.890928
- LINK/USD market cap: $
- LINK/USD circulating supply:
- LINK/USD total supply:
- LINK/USD coin market ranking: #
Key Levels
- Resistance: $ 140.00, $ 145.56, $150.00
- Support: $127.92, $124.00, $120.00
Your capital is at risk
Chainlink Market Price Analysis: The Indicators’ Point of View
The market has been rejected twice at the resistance level of $8.0399257 on the 12th of September and the 18th of September. In today’s market, like in previous times, it appears as if LINK/USD is struggling again at this same price level. The candle that represents today’s trading activities shows a very volatile market, judging from the long shadow above the real body of the candle. At the height of $8.4039279, more traders are selling than those that are willing to buy. The two indicators agree and they are pointing to a stagnant market. The RSI seem stuck at 58.5%. Although the bullish histogram for today still points to a bullish market, the direction of the market may be determined in the next trading session.
Chainlink: LINK/USD 4-Hour Chart Outlook
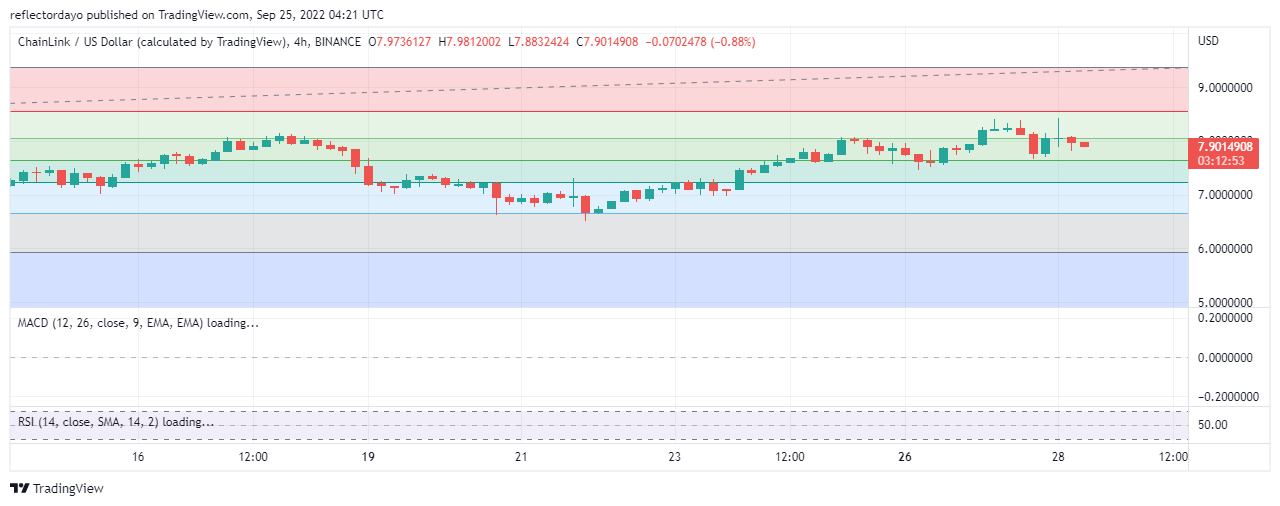
The first trading session for today’s market opened with a very strong market gridlock. Buyers seem ambitious as the price high reached $8.4039279, but both buyers and sellers could not move away from the point where the market opened. Generally speaking, in this timeframe, the market price of Chainlink is consolidating. The tug–of–war is intense at this point. perhaps after this ranging market, the price will fall again.
Join Our Telegram channel to stay up to date on breaking news coverage
